Table of Contents
Profit & Loss Reports
The Profit & Loss Reports page provides a summary of the business's financial performance for a selected period by comparing total income with total expenses and calculating the resulting profit or loss.
From this page, you can:
- View the Profit & Loss report for a selected date range.
- Filter the report by branch.
- View the Total Income, Total Expense, and Net Profit.
- Analyze income grouped by ledger.
- Review expense details grouped by expense ledger, kitchen department, category, and product.
- Expand or collapse expense groups to view detailed cost breakdowns.
- Export the Profit & Loss report to Microsoft Excel.
For the Restaurant Vertical, the Profit & Loss report is generated using operational business data.
The report is calculated as follows:
- Total Income - Revenue generated from Sales and Outdoor Billing during the selected period.
- Total Expense - Operational expenses together with the cost of raw materials consumed through approved kitchen indents.
- Net Profit - The difference between Total Income and Total Expense.
The expense section is displayed in a hierarchical structure to provide detailed cost analysis:
- Expense Ledger
- Department
- Category
- Product
This allows users to drill down from overall departmental expenses to individual product-level consumption costs.
The report displays the following summary information:
- Total Income - Total revenue earned during the selected period.
- Total Expense - Total operational and inventory consumption costs incurred during the selected period.
- Net Profit - The profit earned after deducting all expenses from the total income.
The Export XLSX option downloads the Profit & Loss report in Microsoft Excel format using the currently applied filters.
Note: For the Restaurant Vertical, inventory purchases received through Goods Receipt Notes (GRNs) are not treated as expenses immediately. They become expenses only when the corresponding raw materials are consumed through approved kitchen indents. This ensures that the Profit & Loss report reflects the actual cost of goods consumed rather than the value of inventory purchased.
To open the Profit & Loss Reports page, follow the steps below.
- Go to the Main Menu. Expand Accounting. Click Profit / Loss. The Profit & Loss Reports page is displayed.
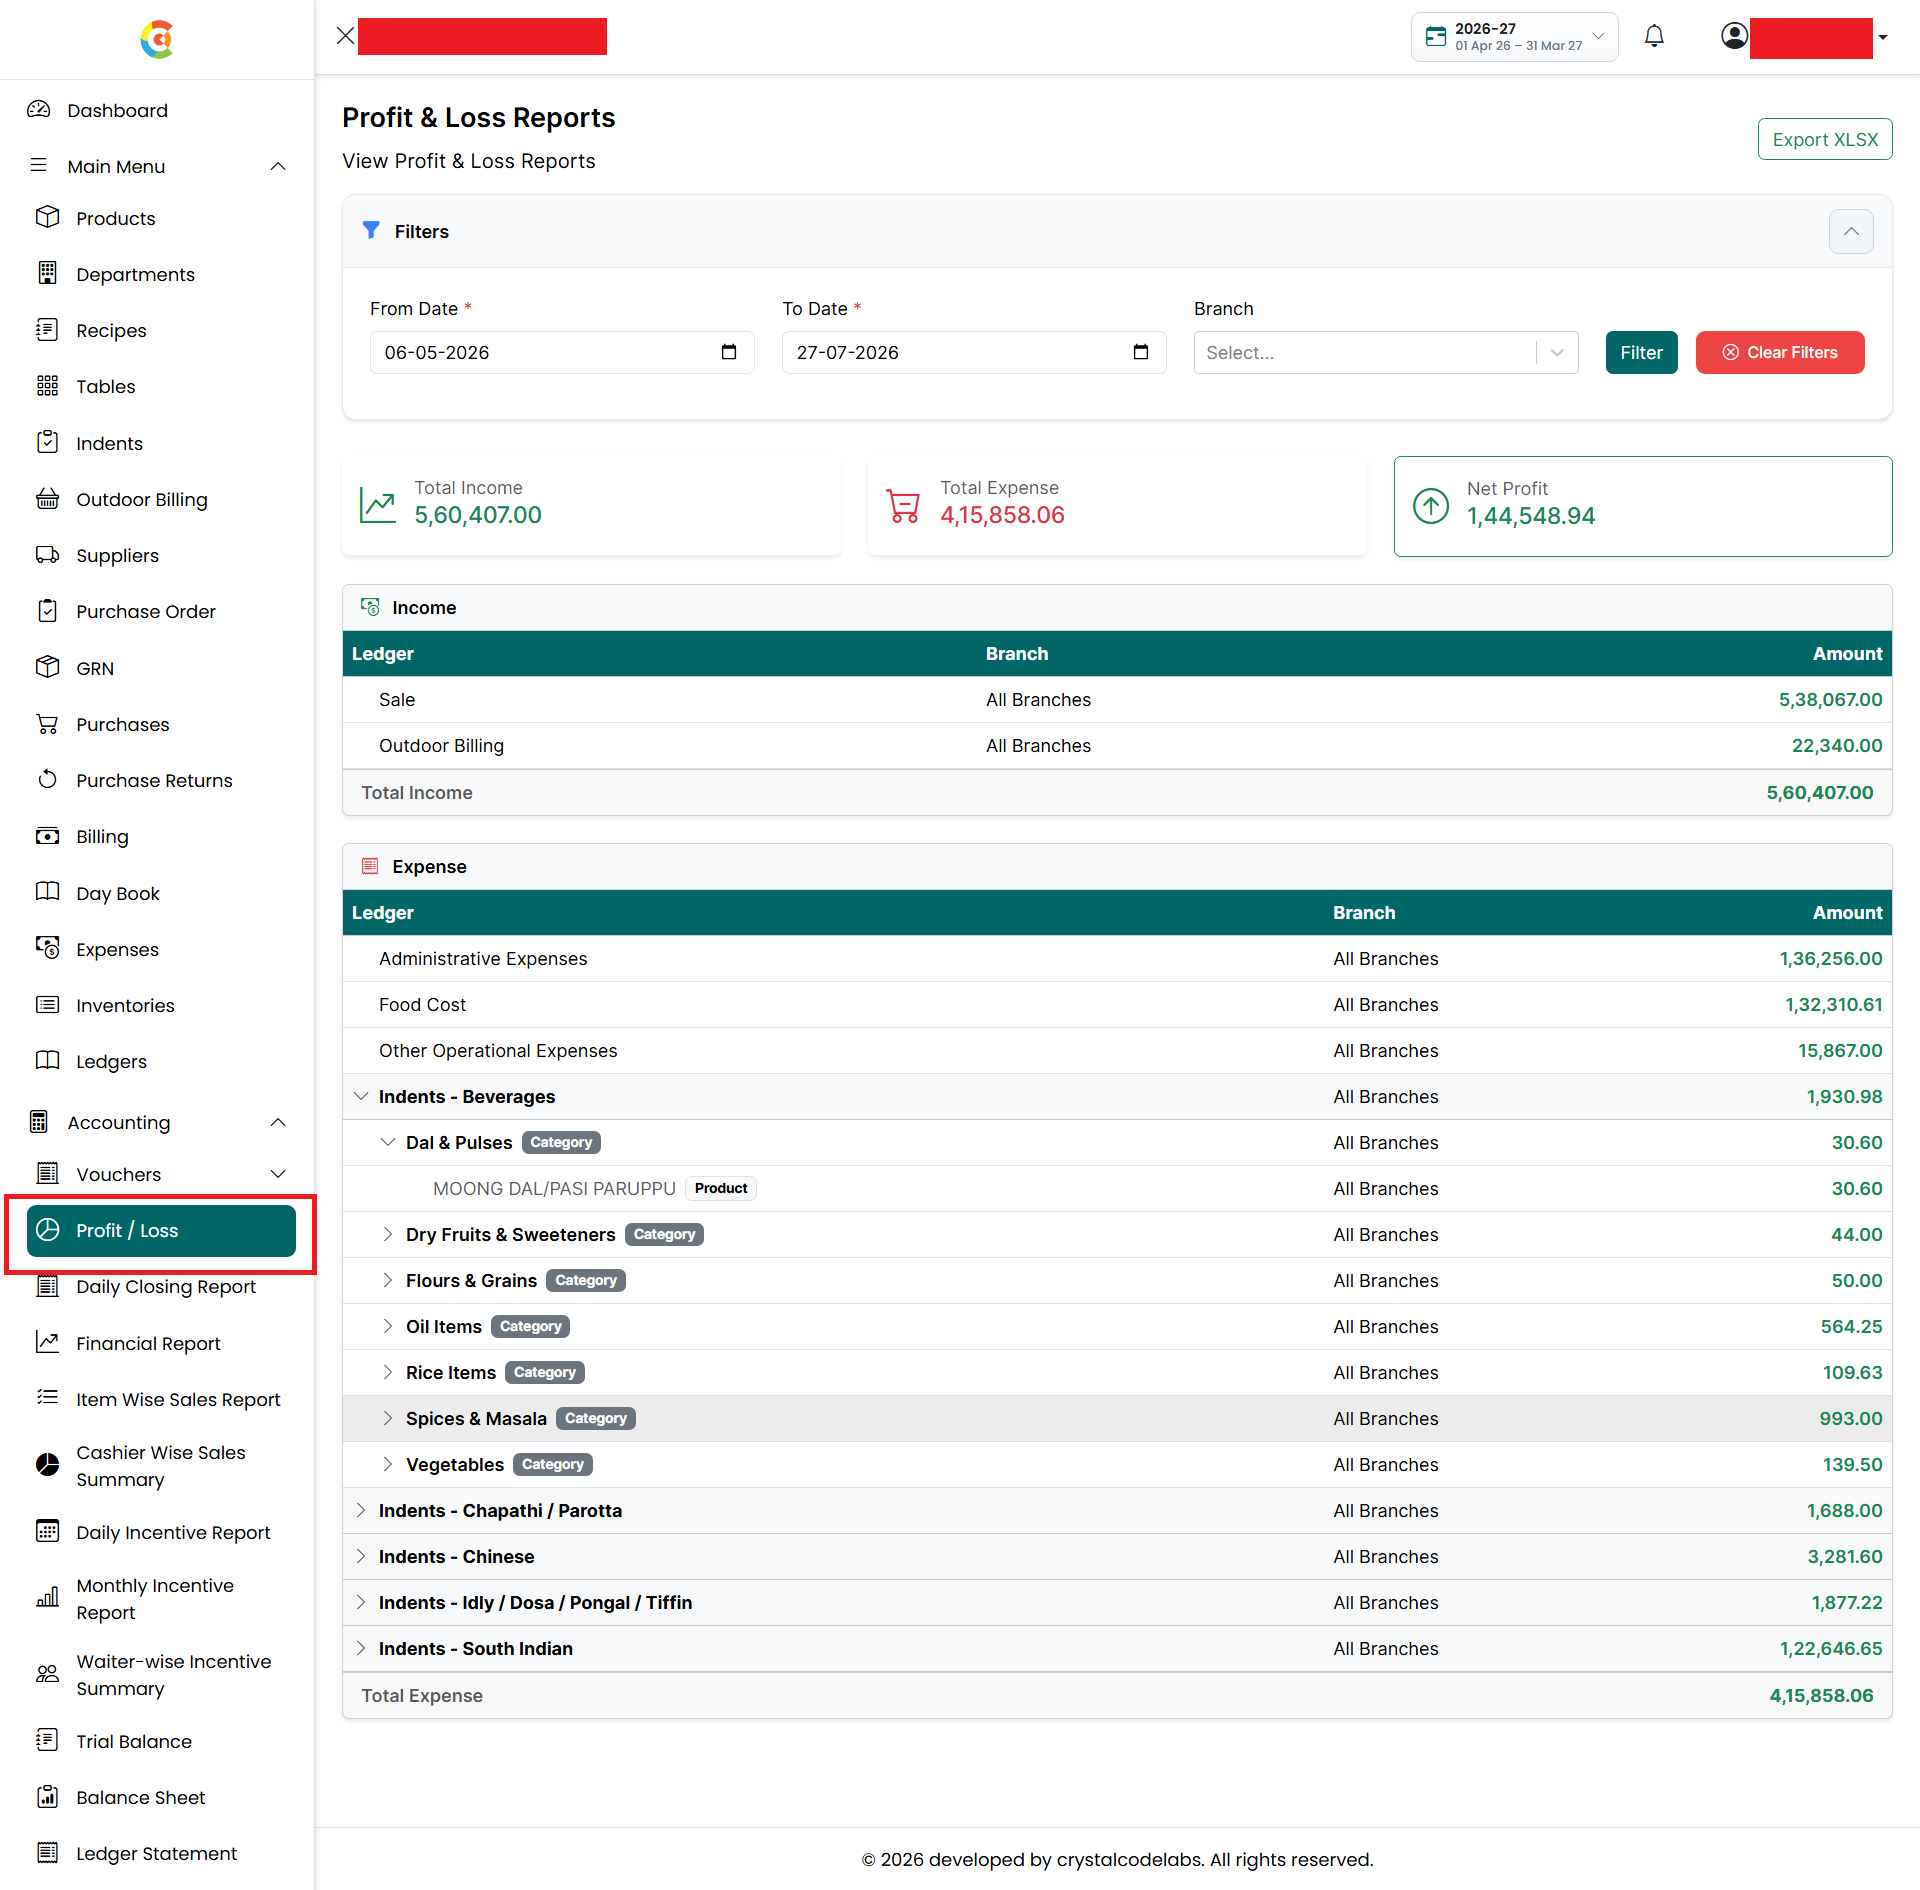
The page includes the following sections:
- Filters
- Filter the report using one or more of the following options:
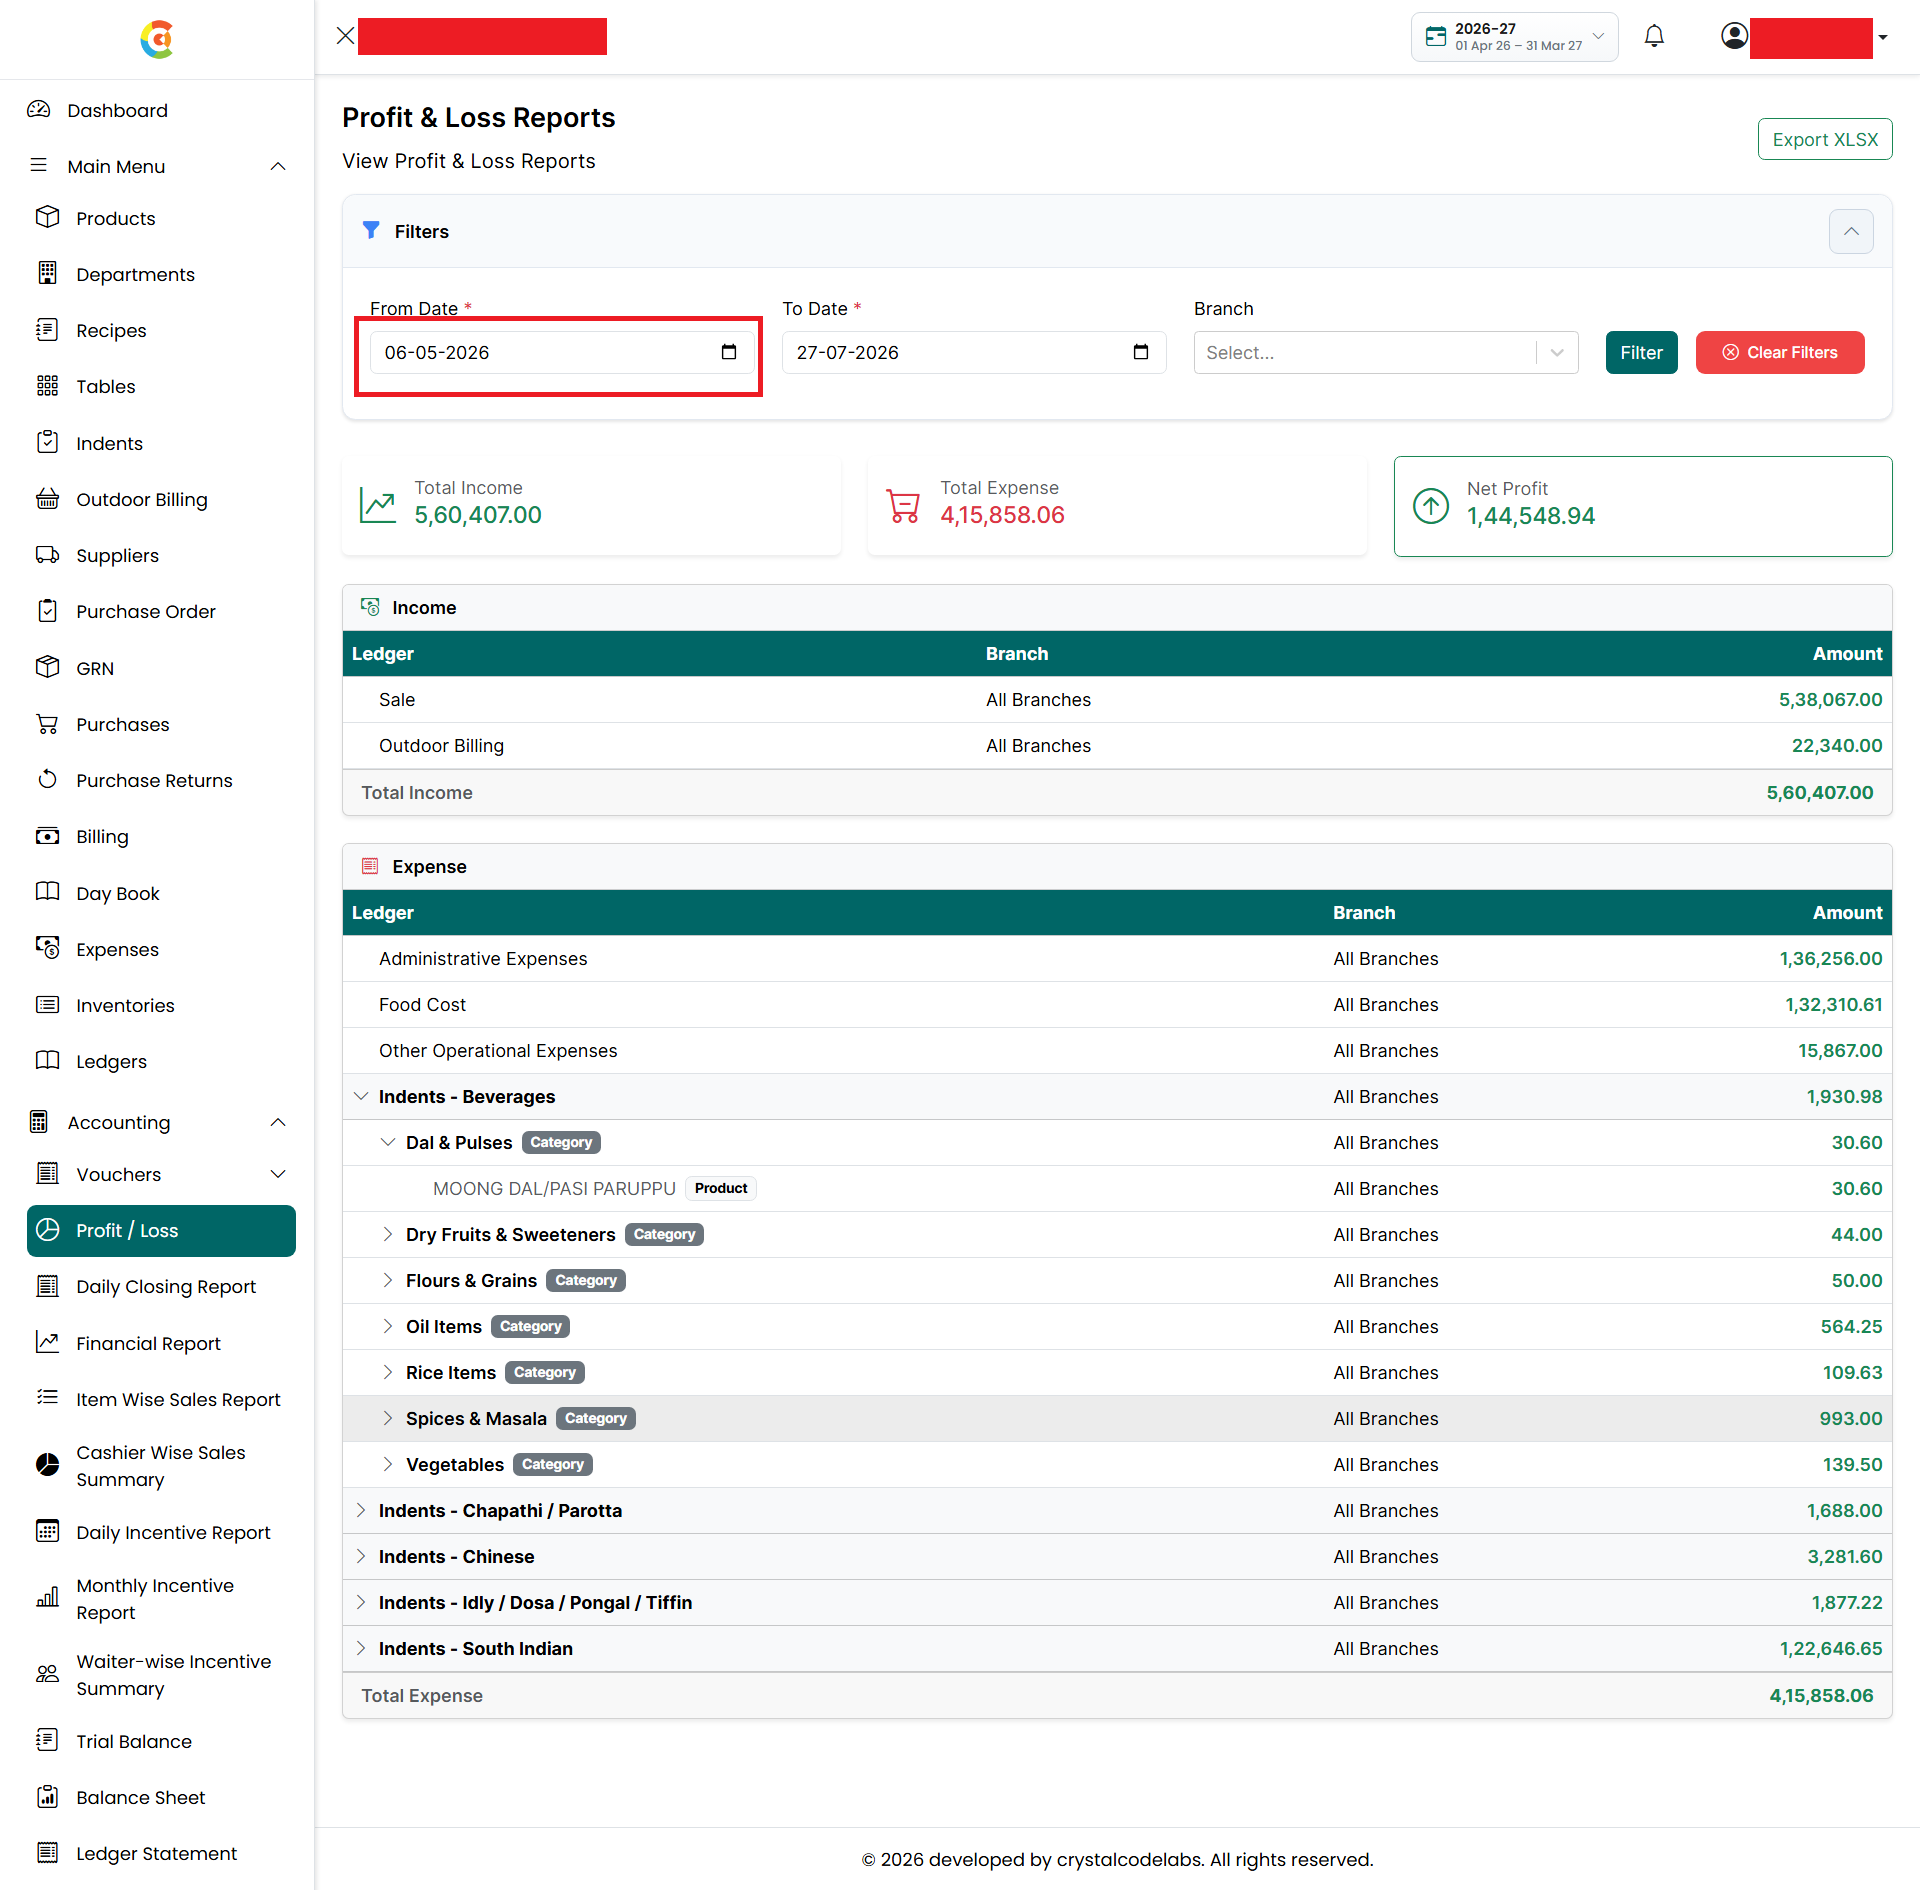
- From Date - Select the starting date for the report.
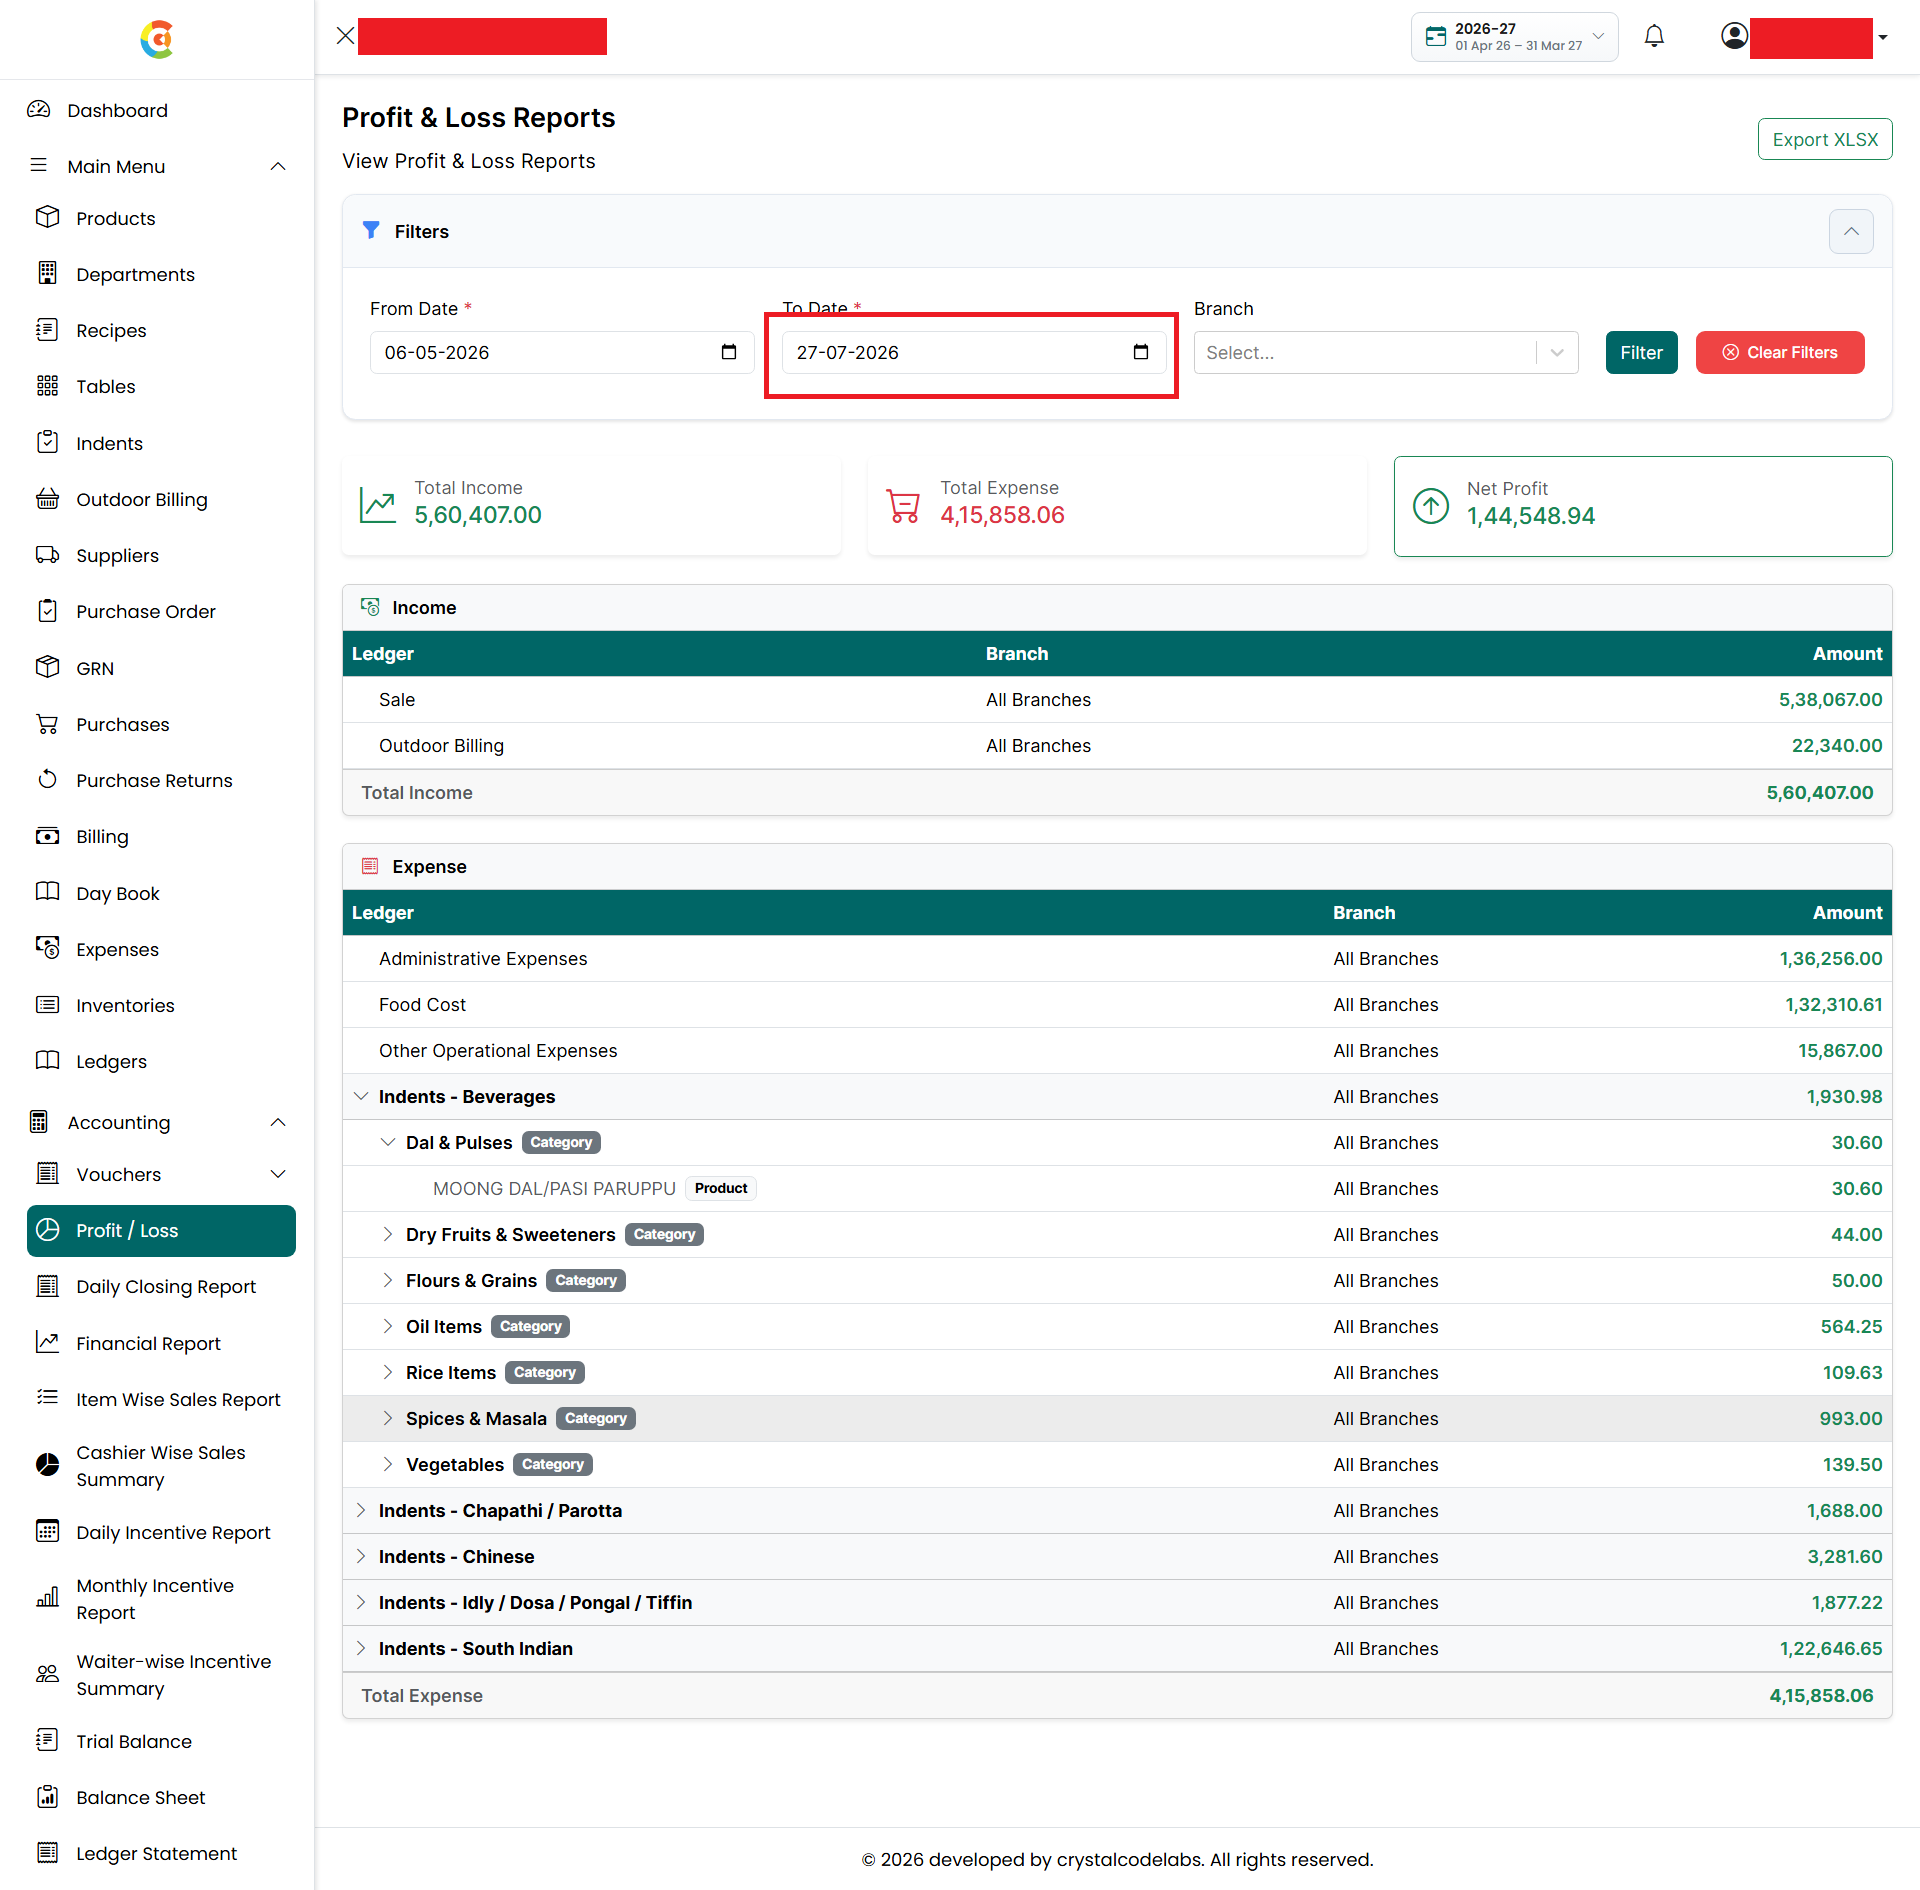
- To Date - Select the ending date for the report.
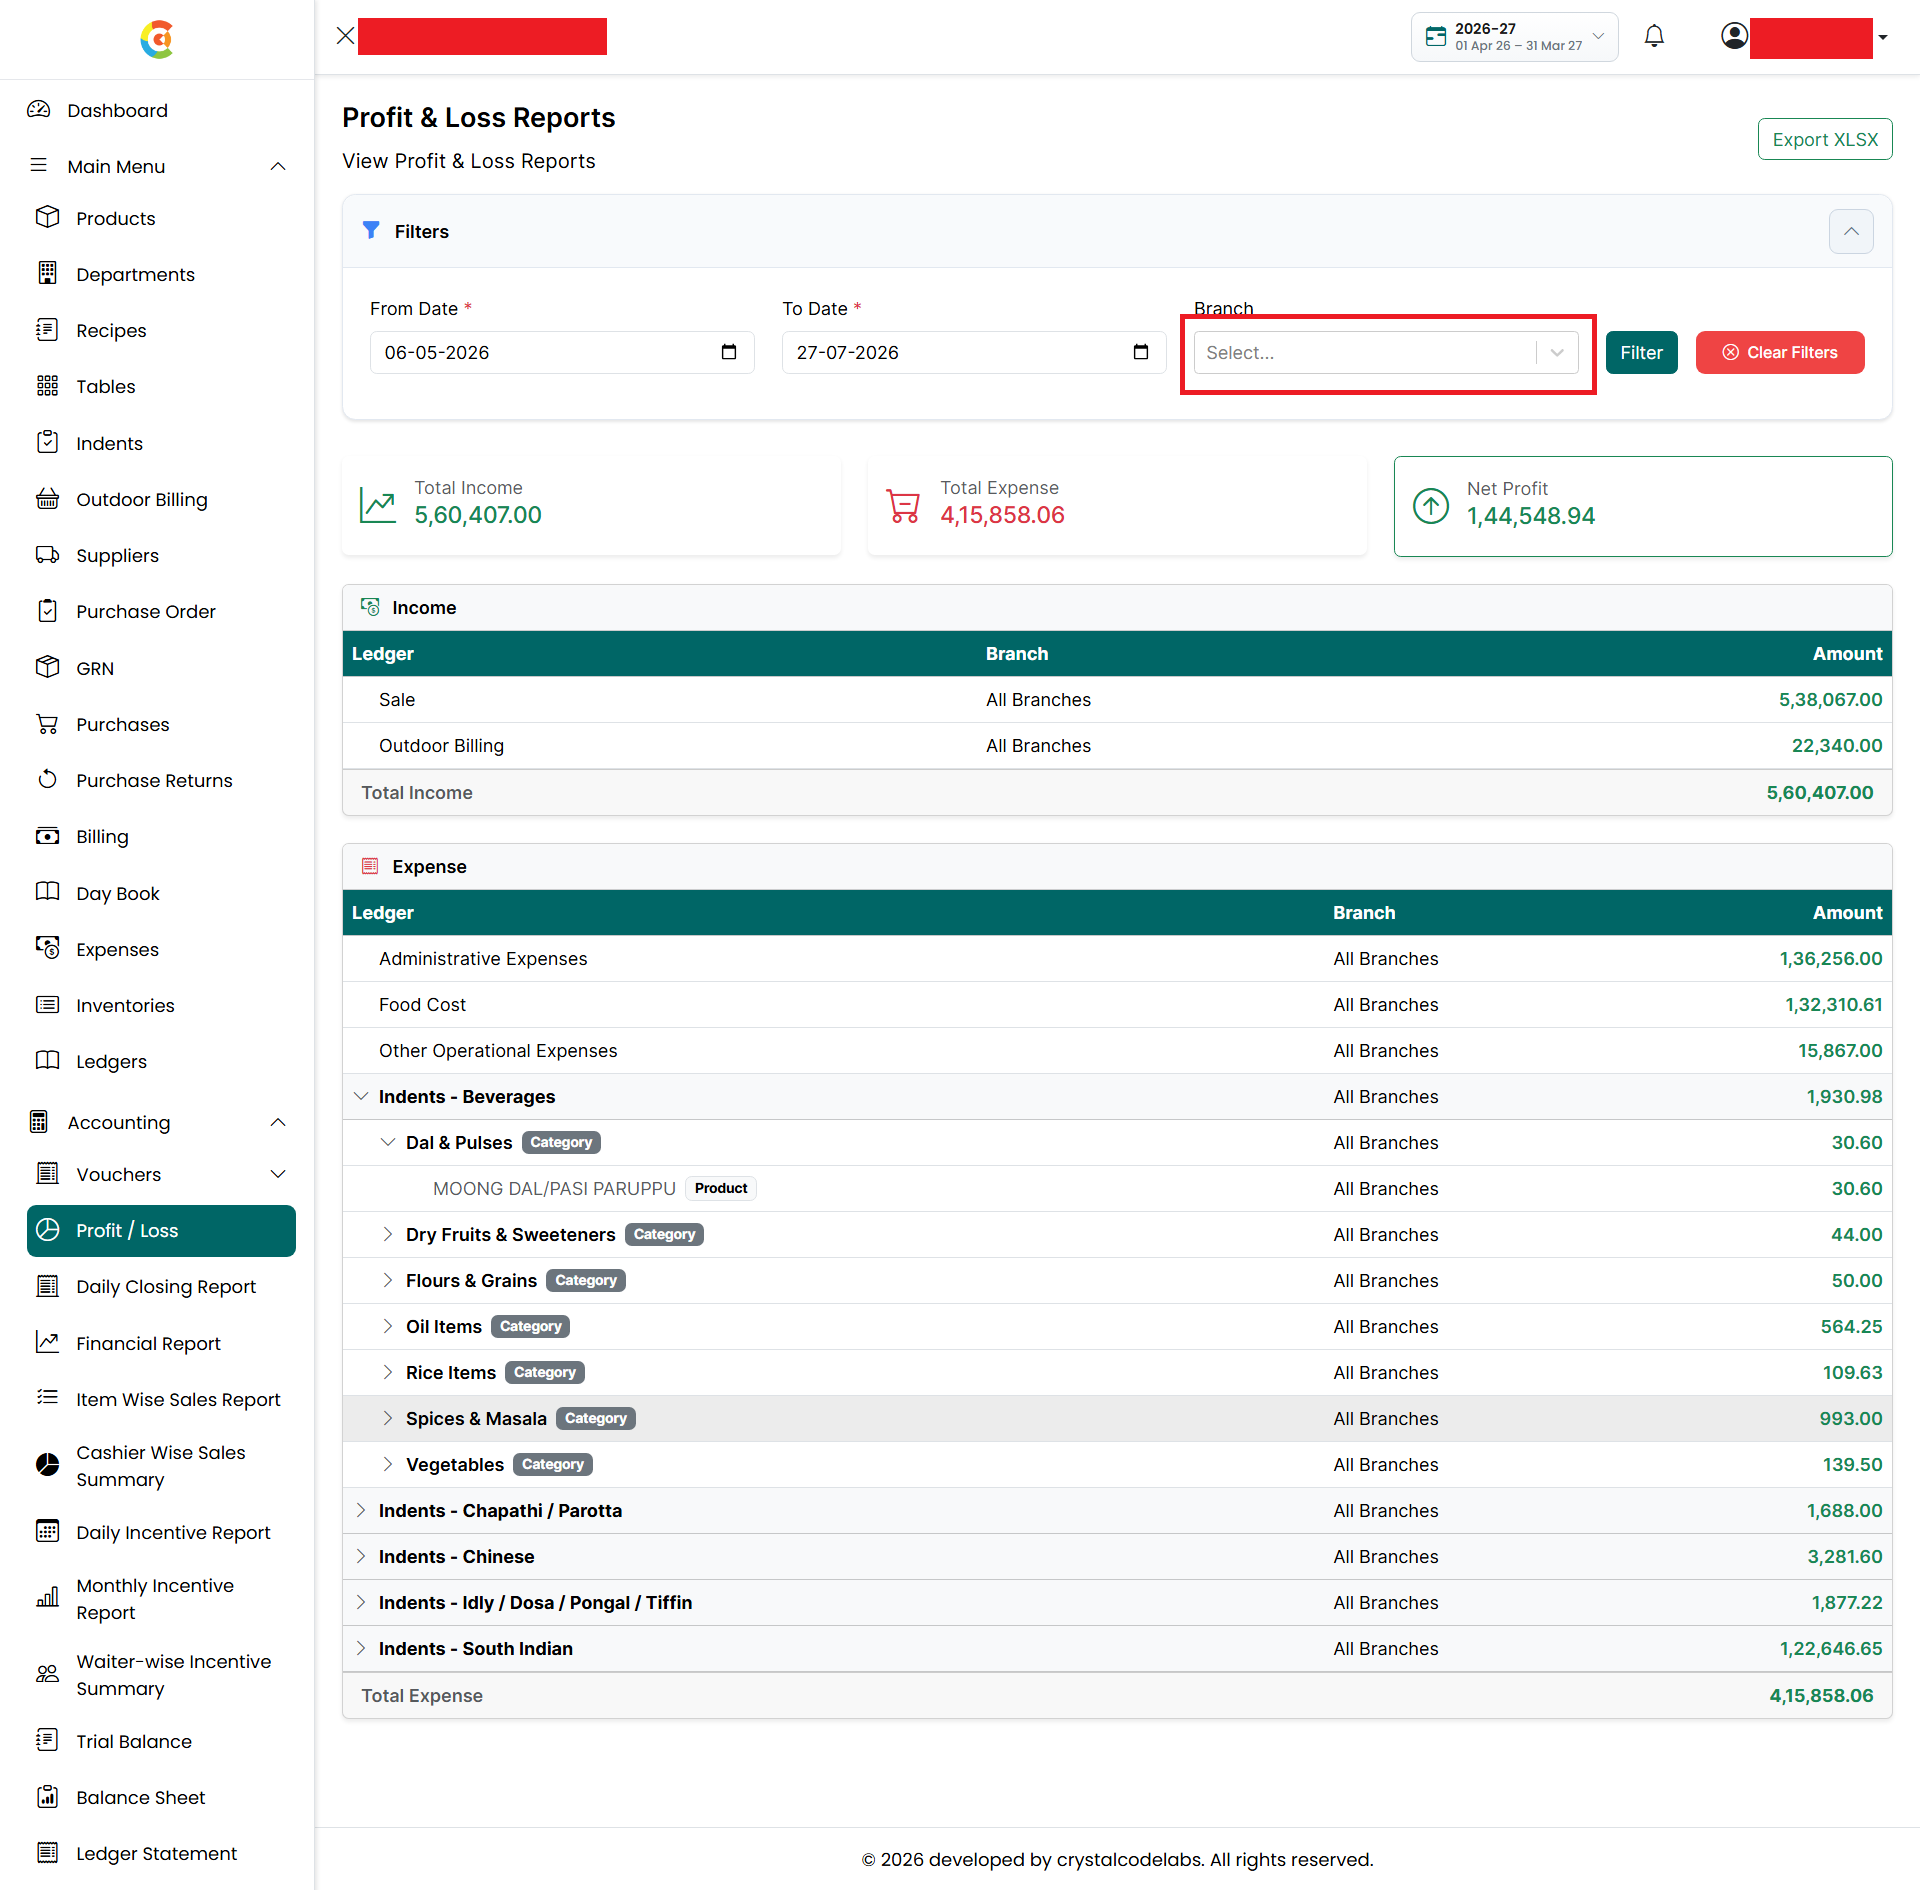
- Branch - Select a specific branch or leave blank to view all branches.
- Filter - Click to generate the report based on the selected filters.
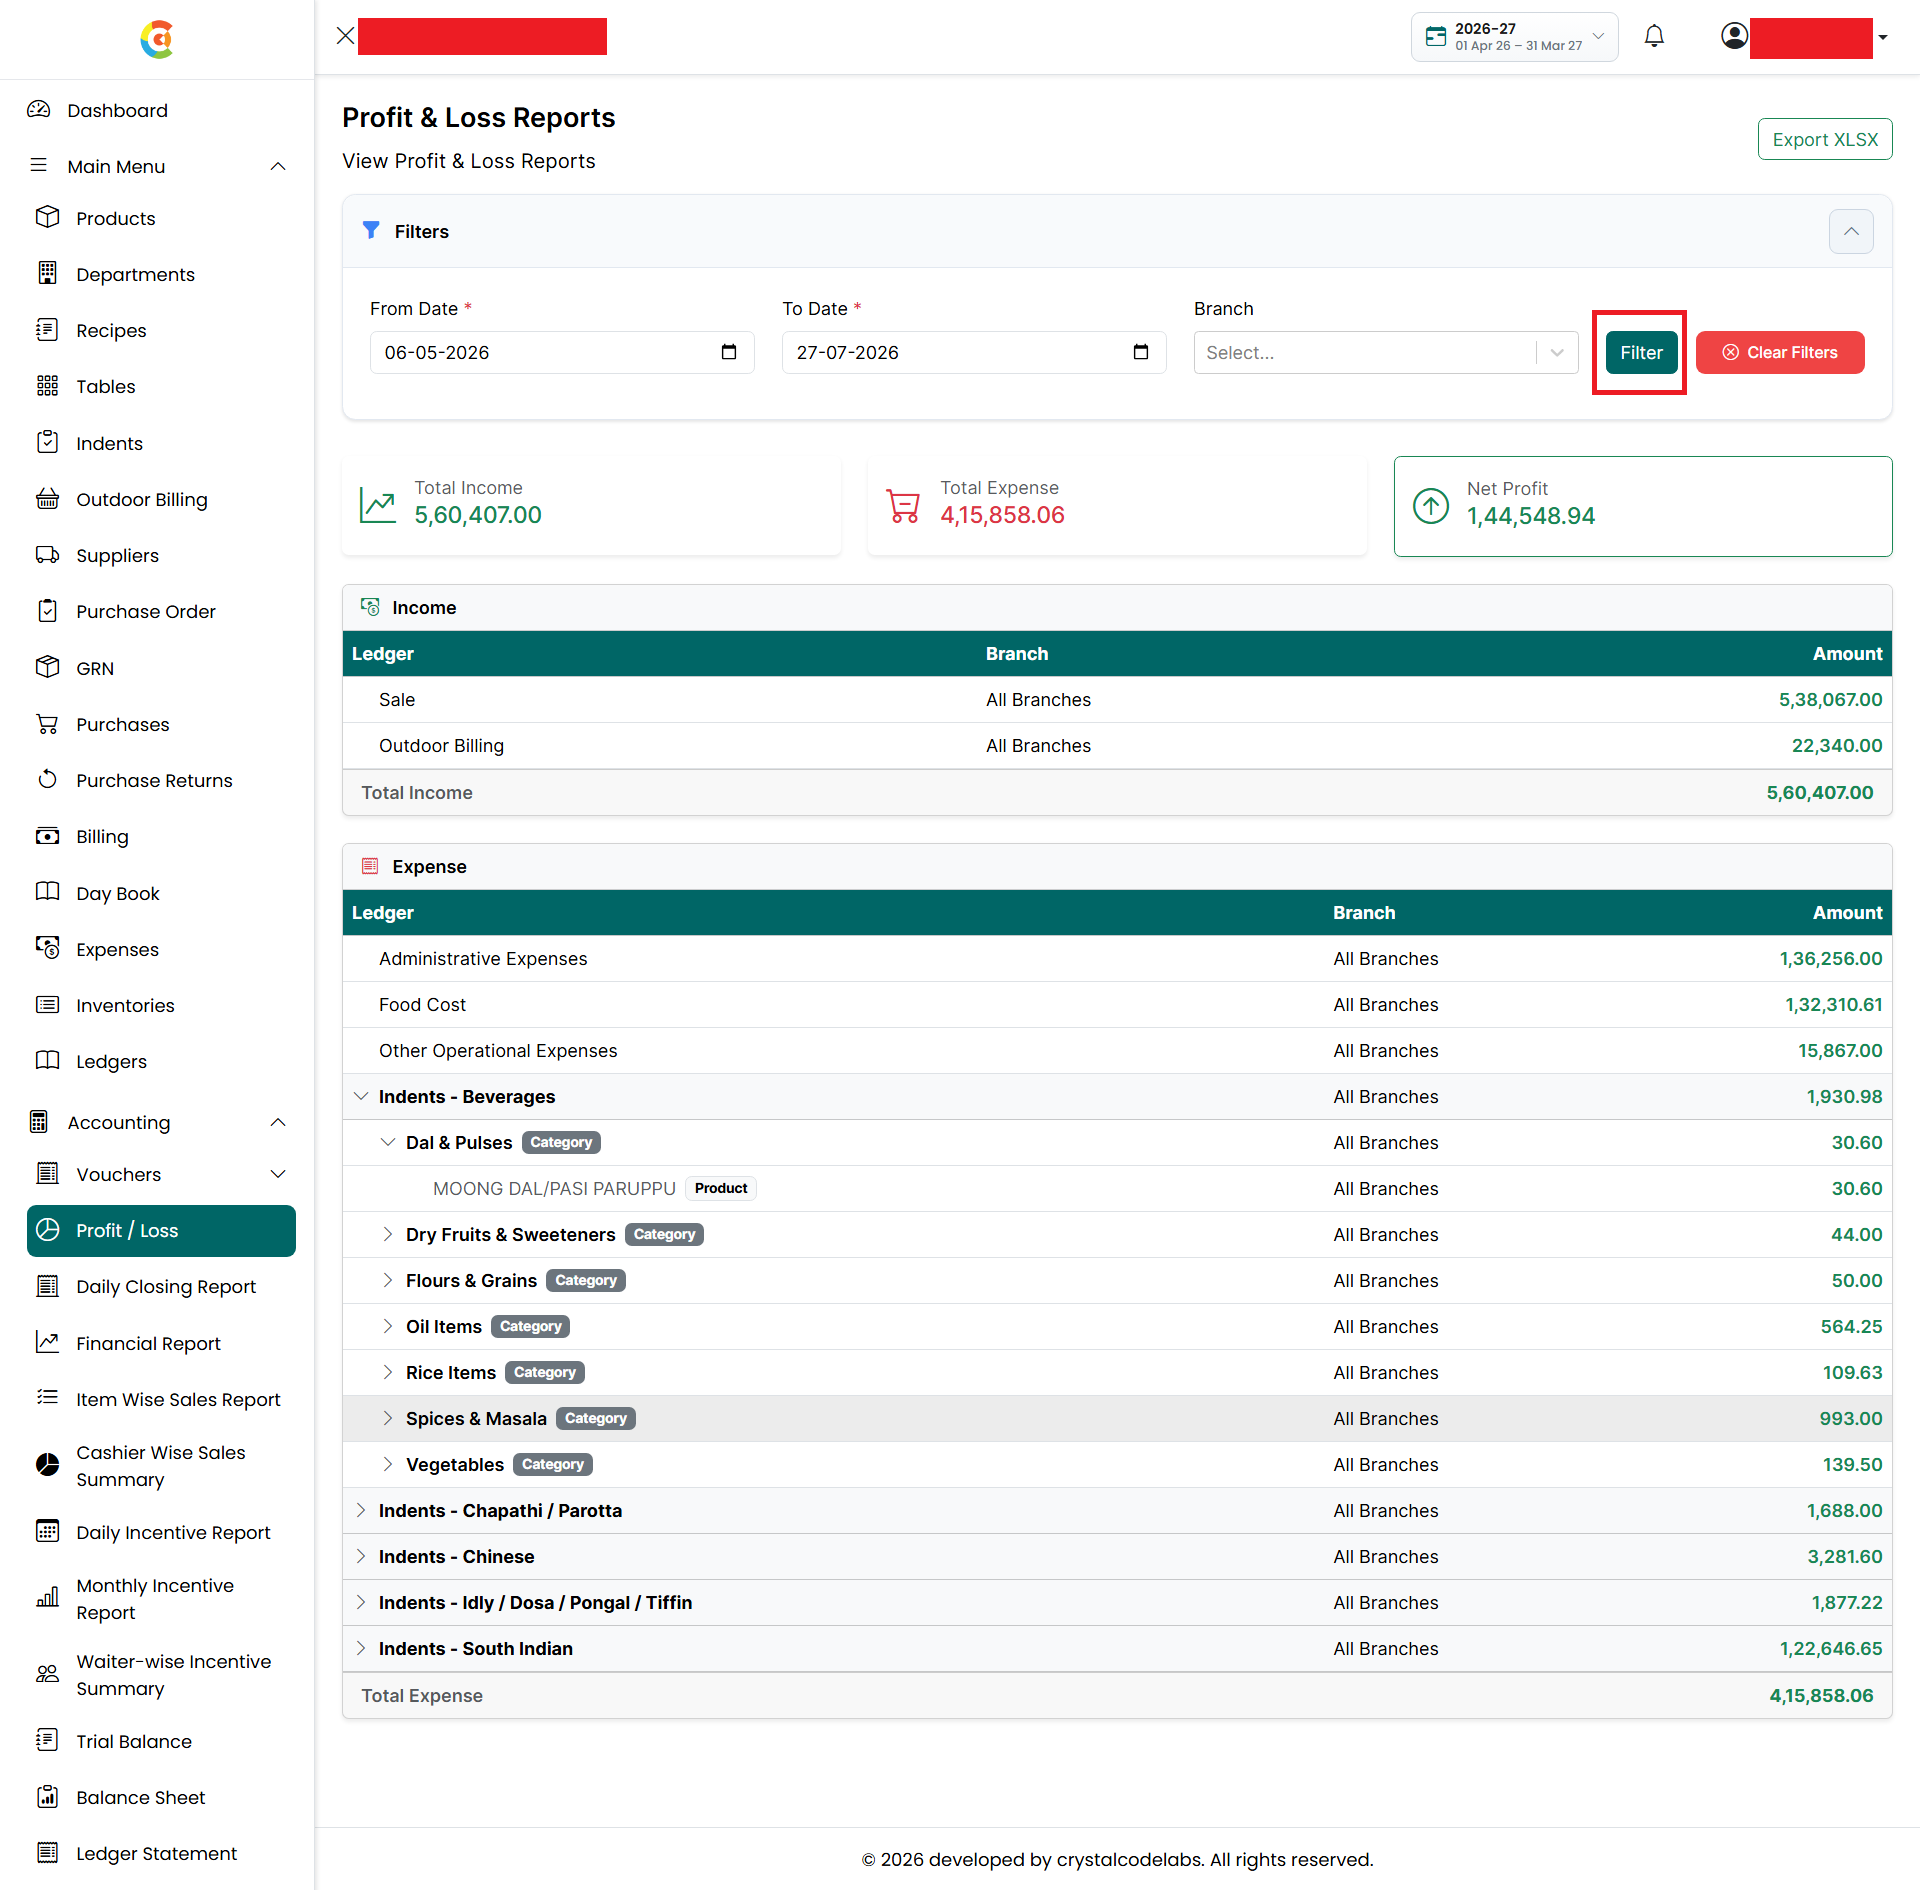
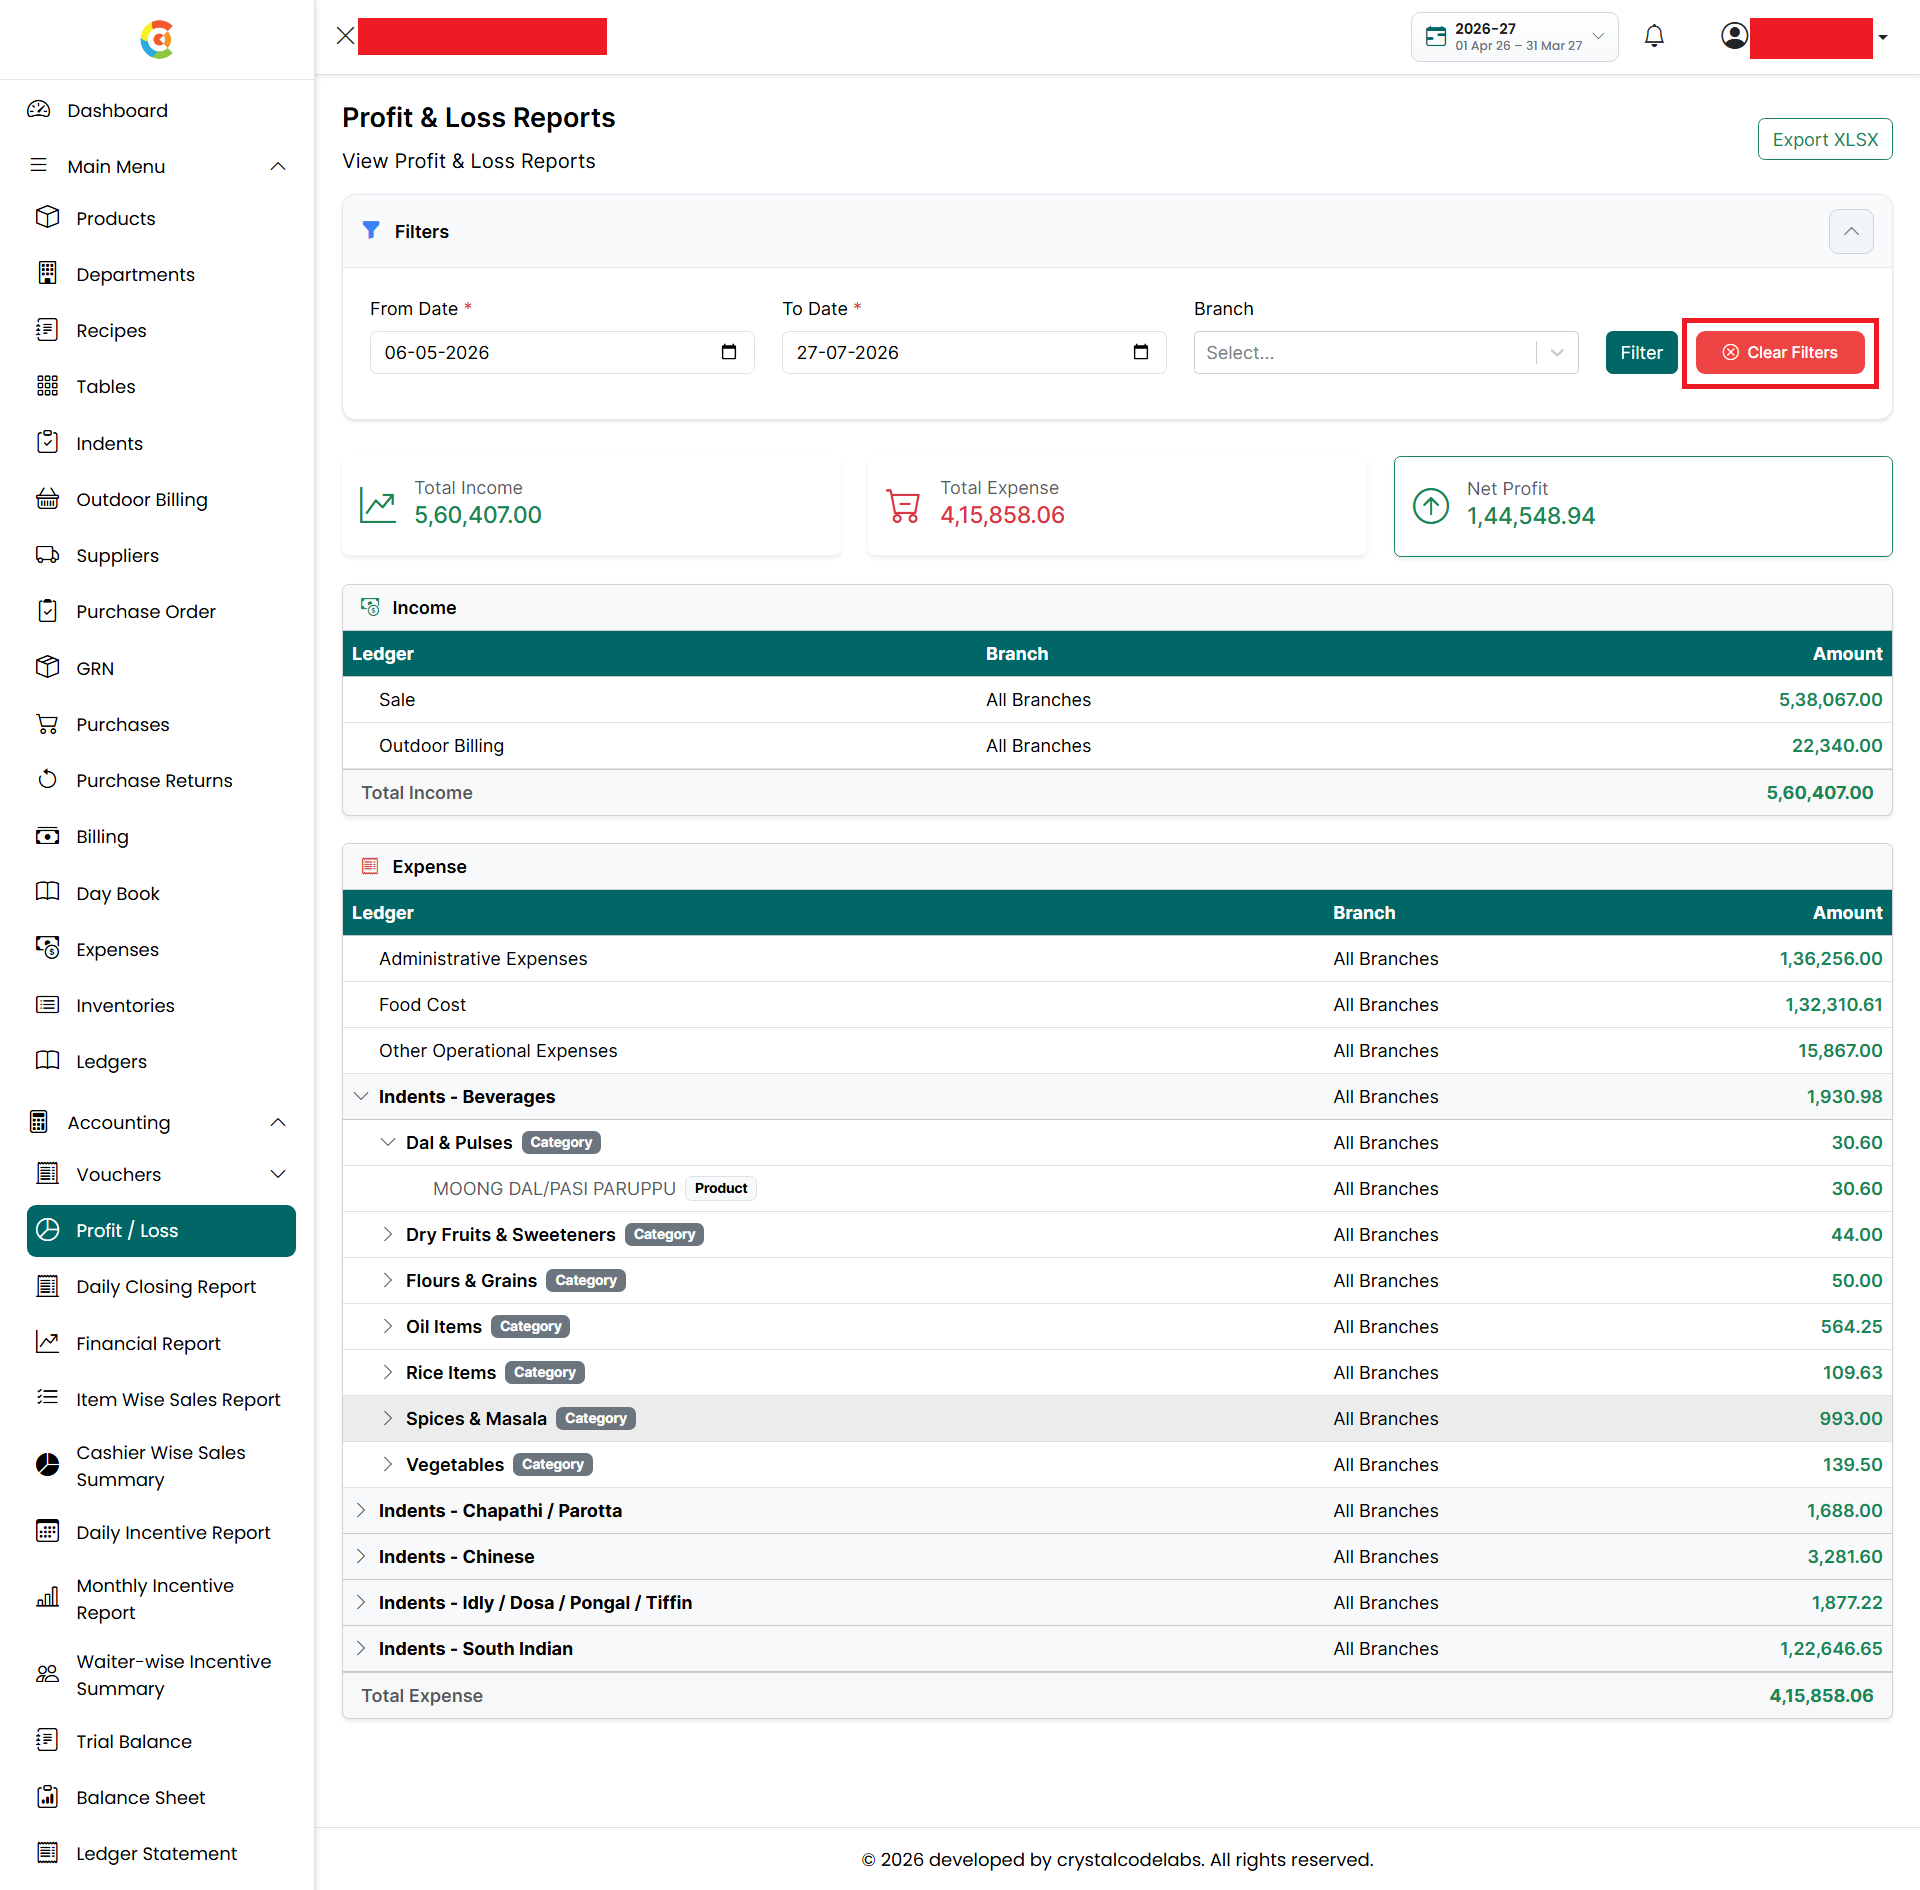
- Clear Filters - Click to remove all applied filters and display the default report.
- Summary Cards
- The report displays the following financial summary:
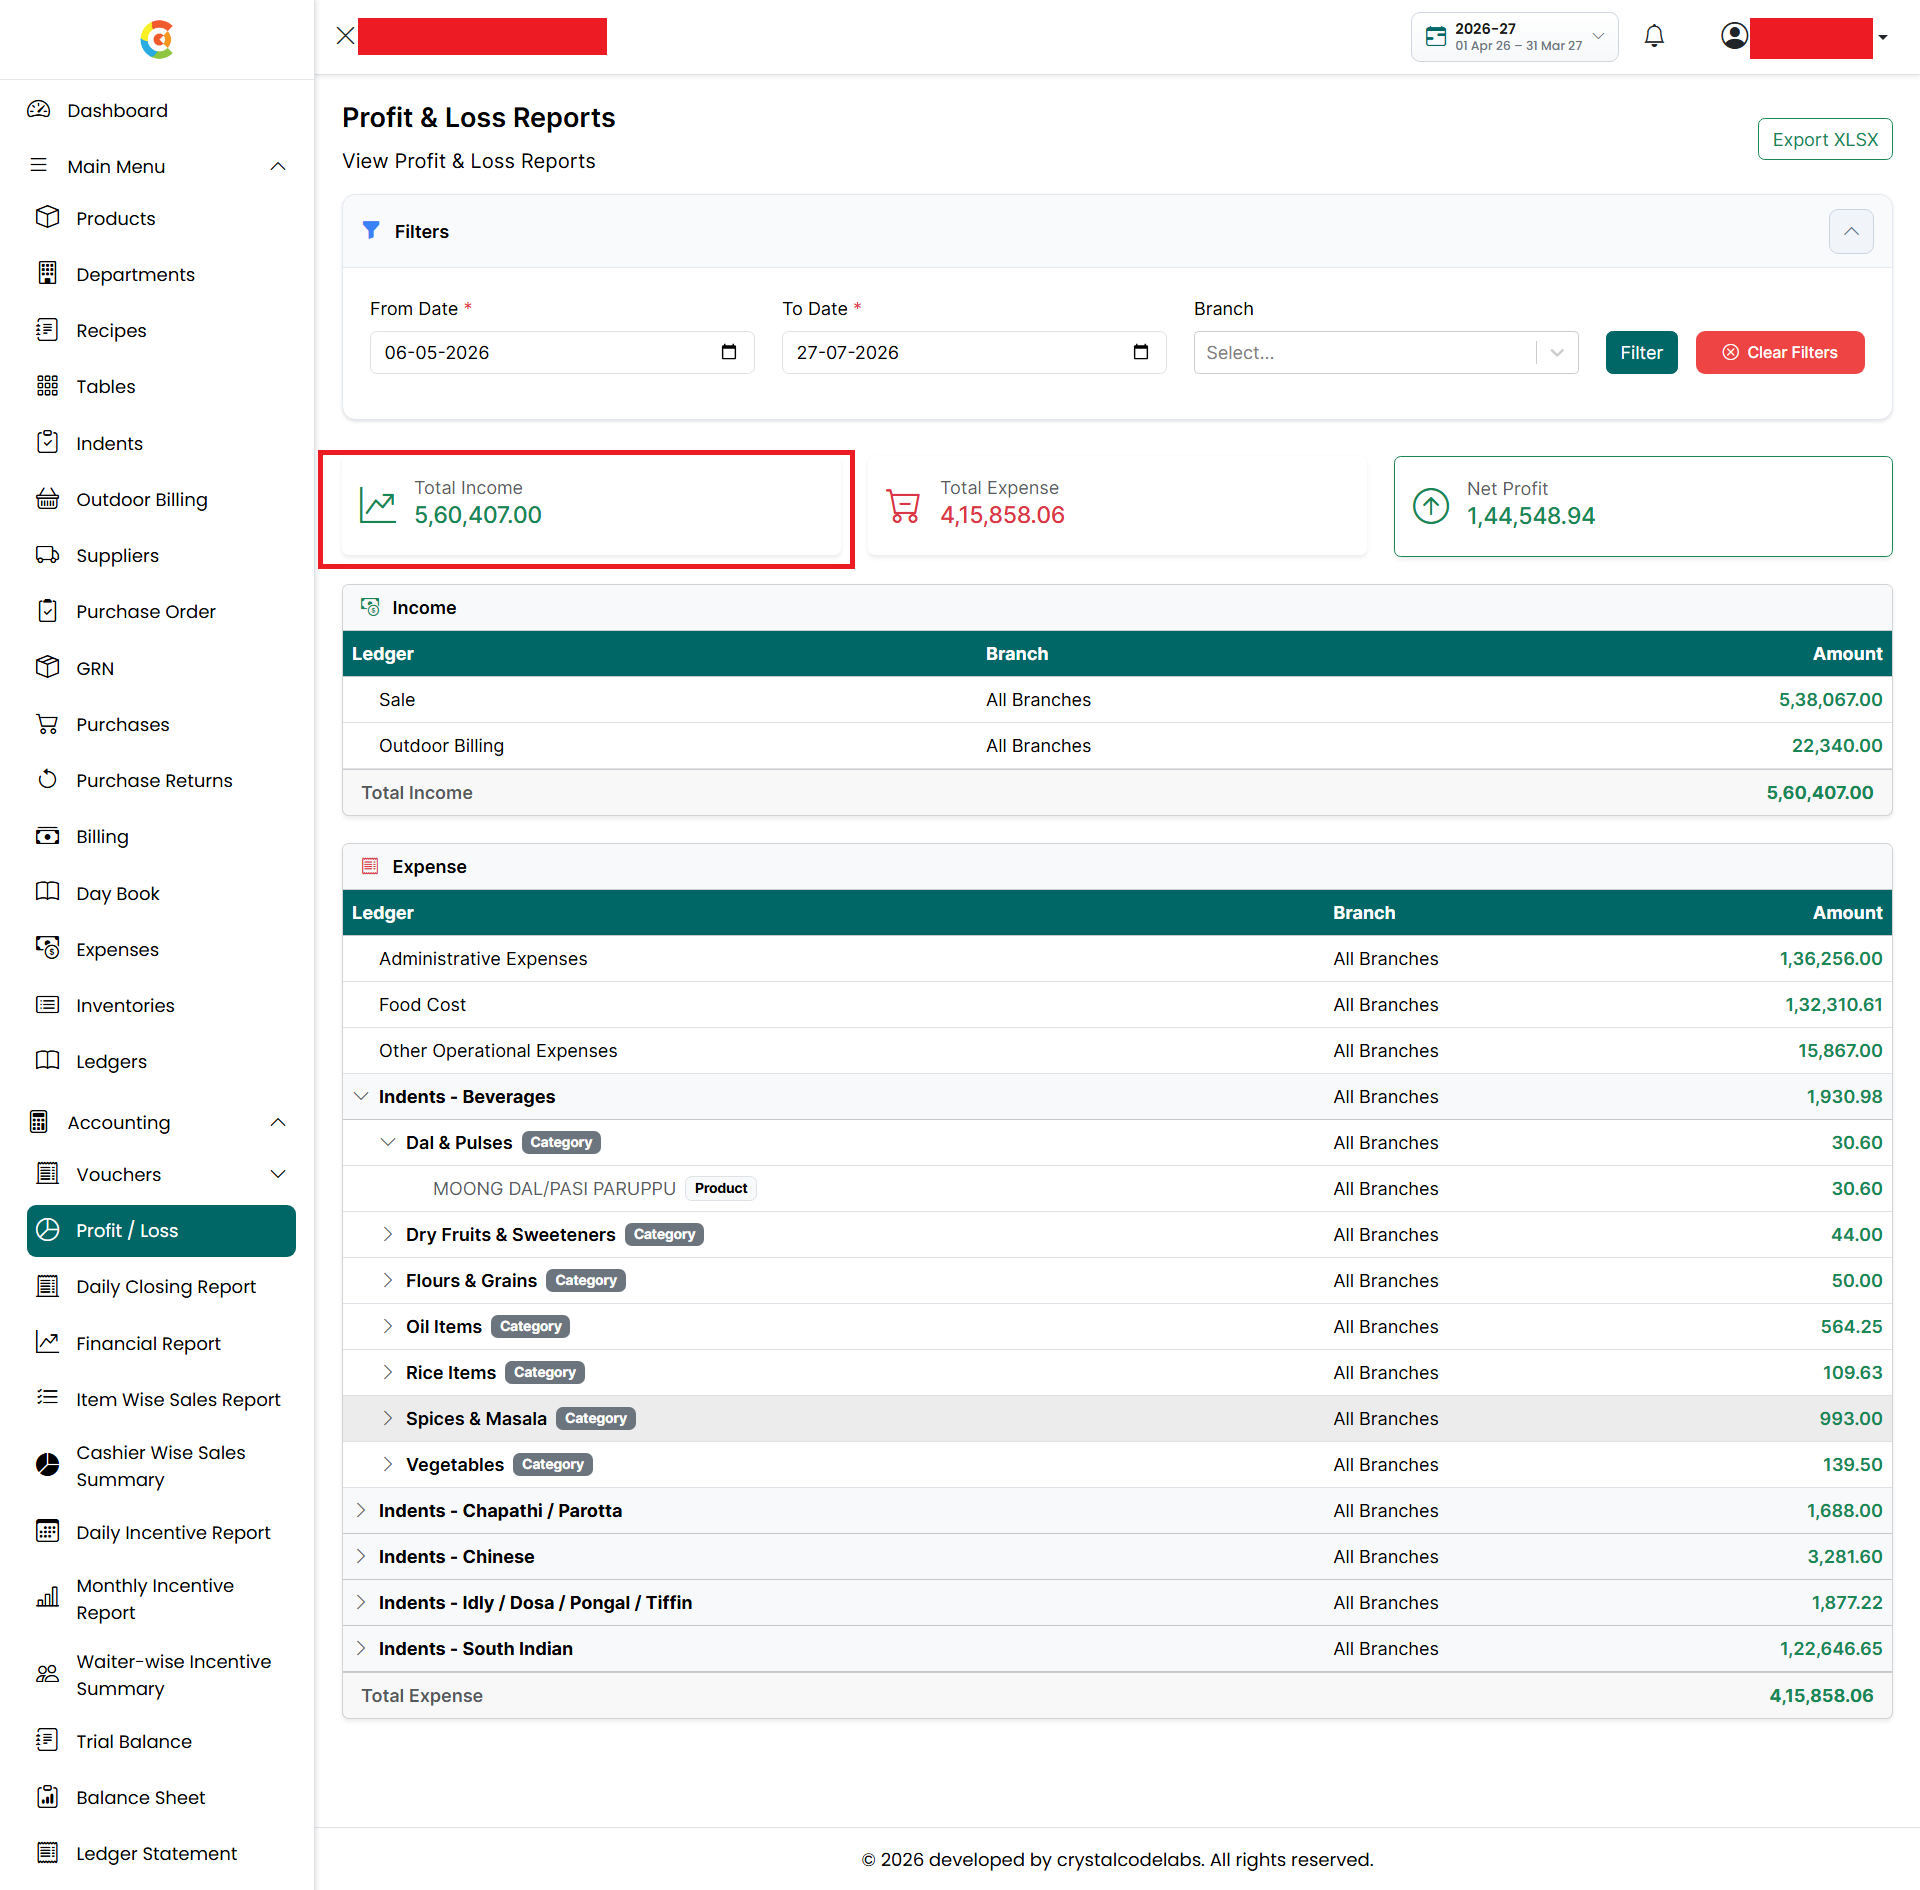
- Total Income - Displays the total revenue earned during the selected period.
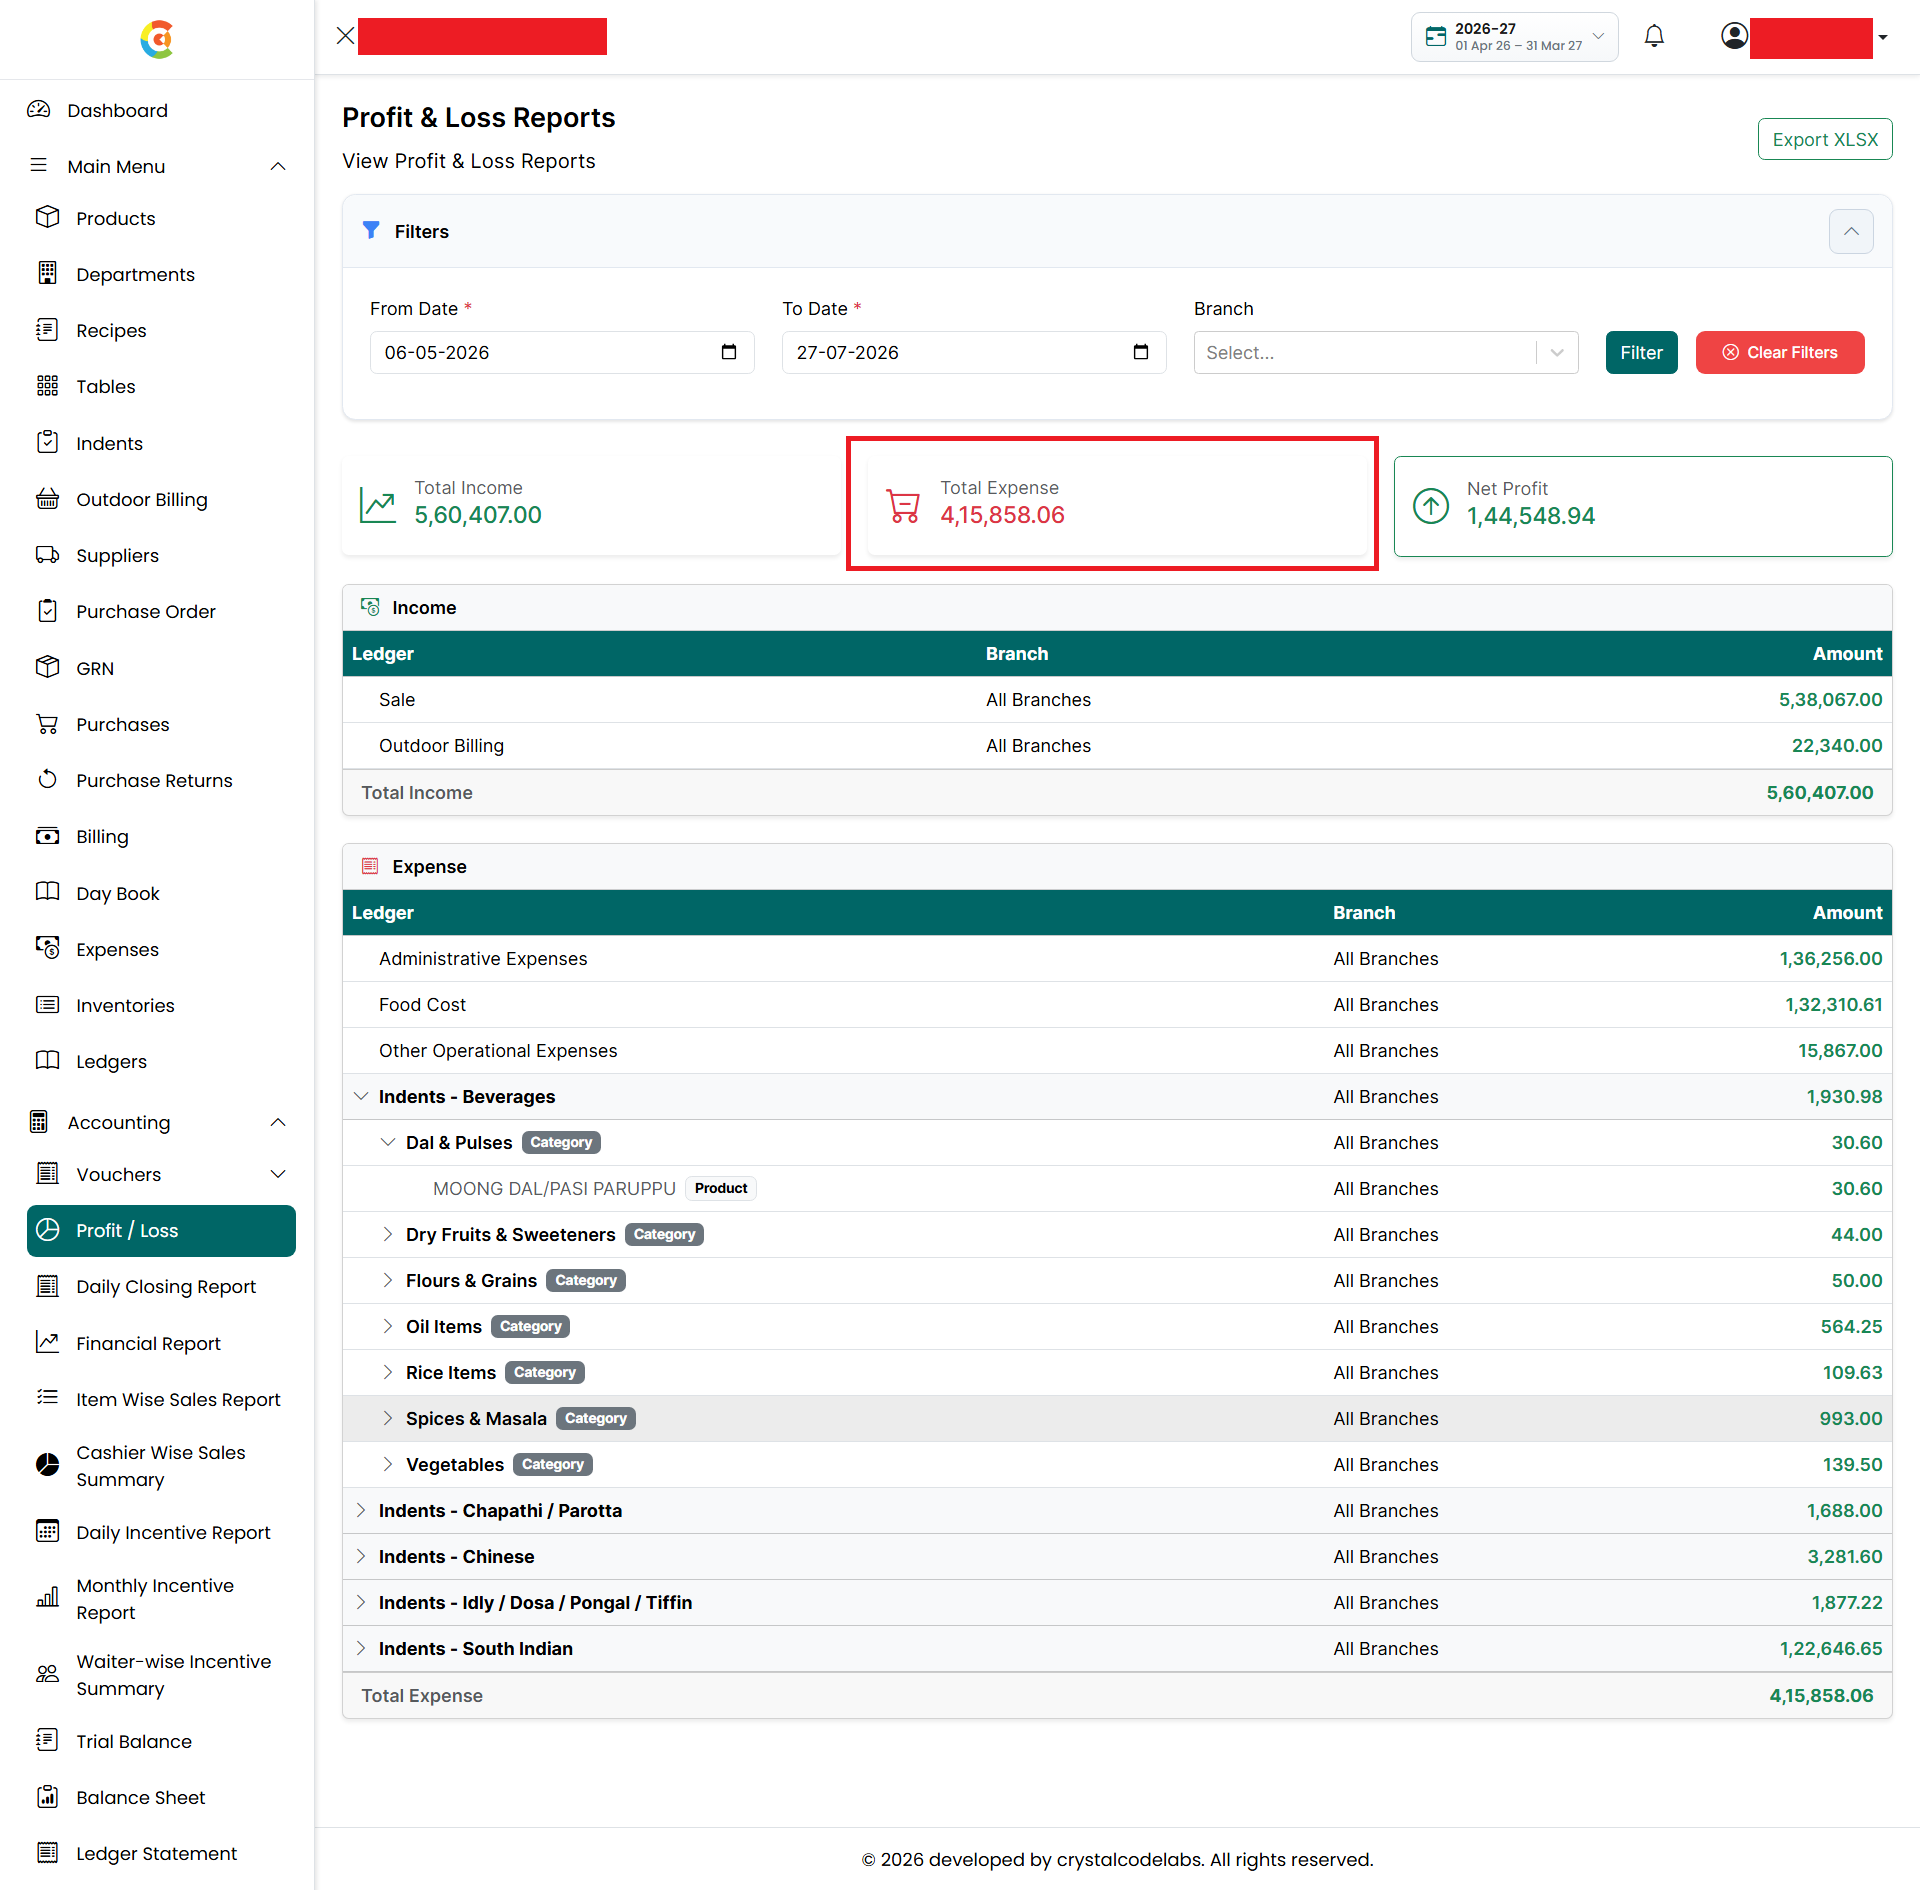
- Total Expense - Displays the total operating expenses incurred during the selected period.
- Net Profit - Displays the difference between the total income and total expenses.
- The application automatically calculates the net profit using the following formula:
- Net Profit = Total Income − Total Expense
- A positive value indicates that the business has earned a profit, while a negative value indicates a loss.

- Income
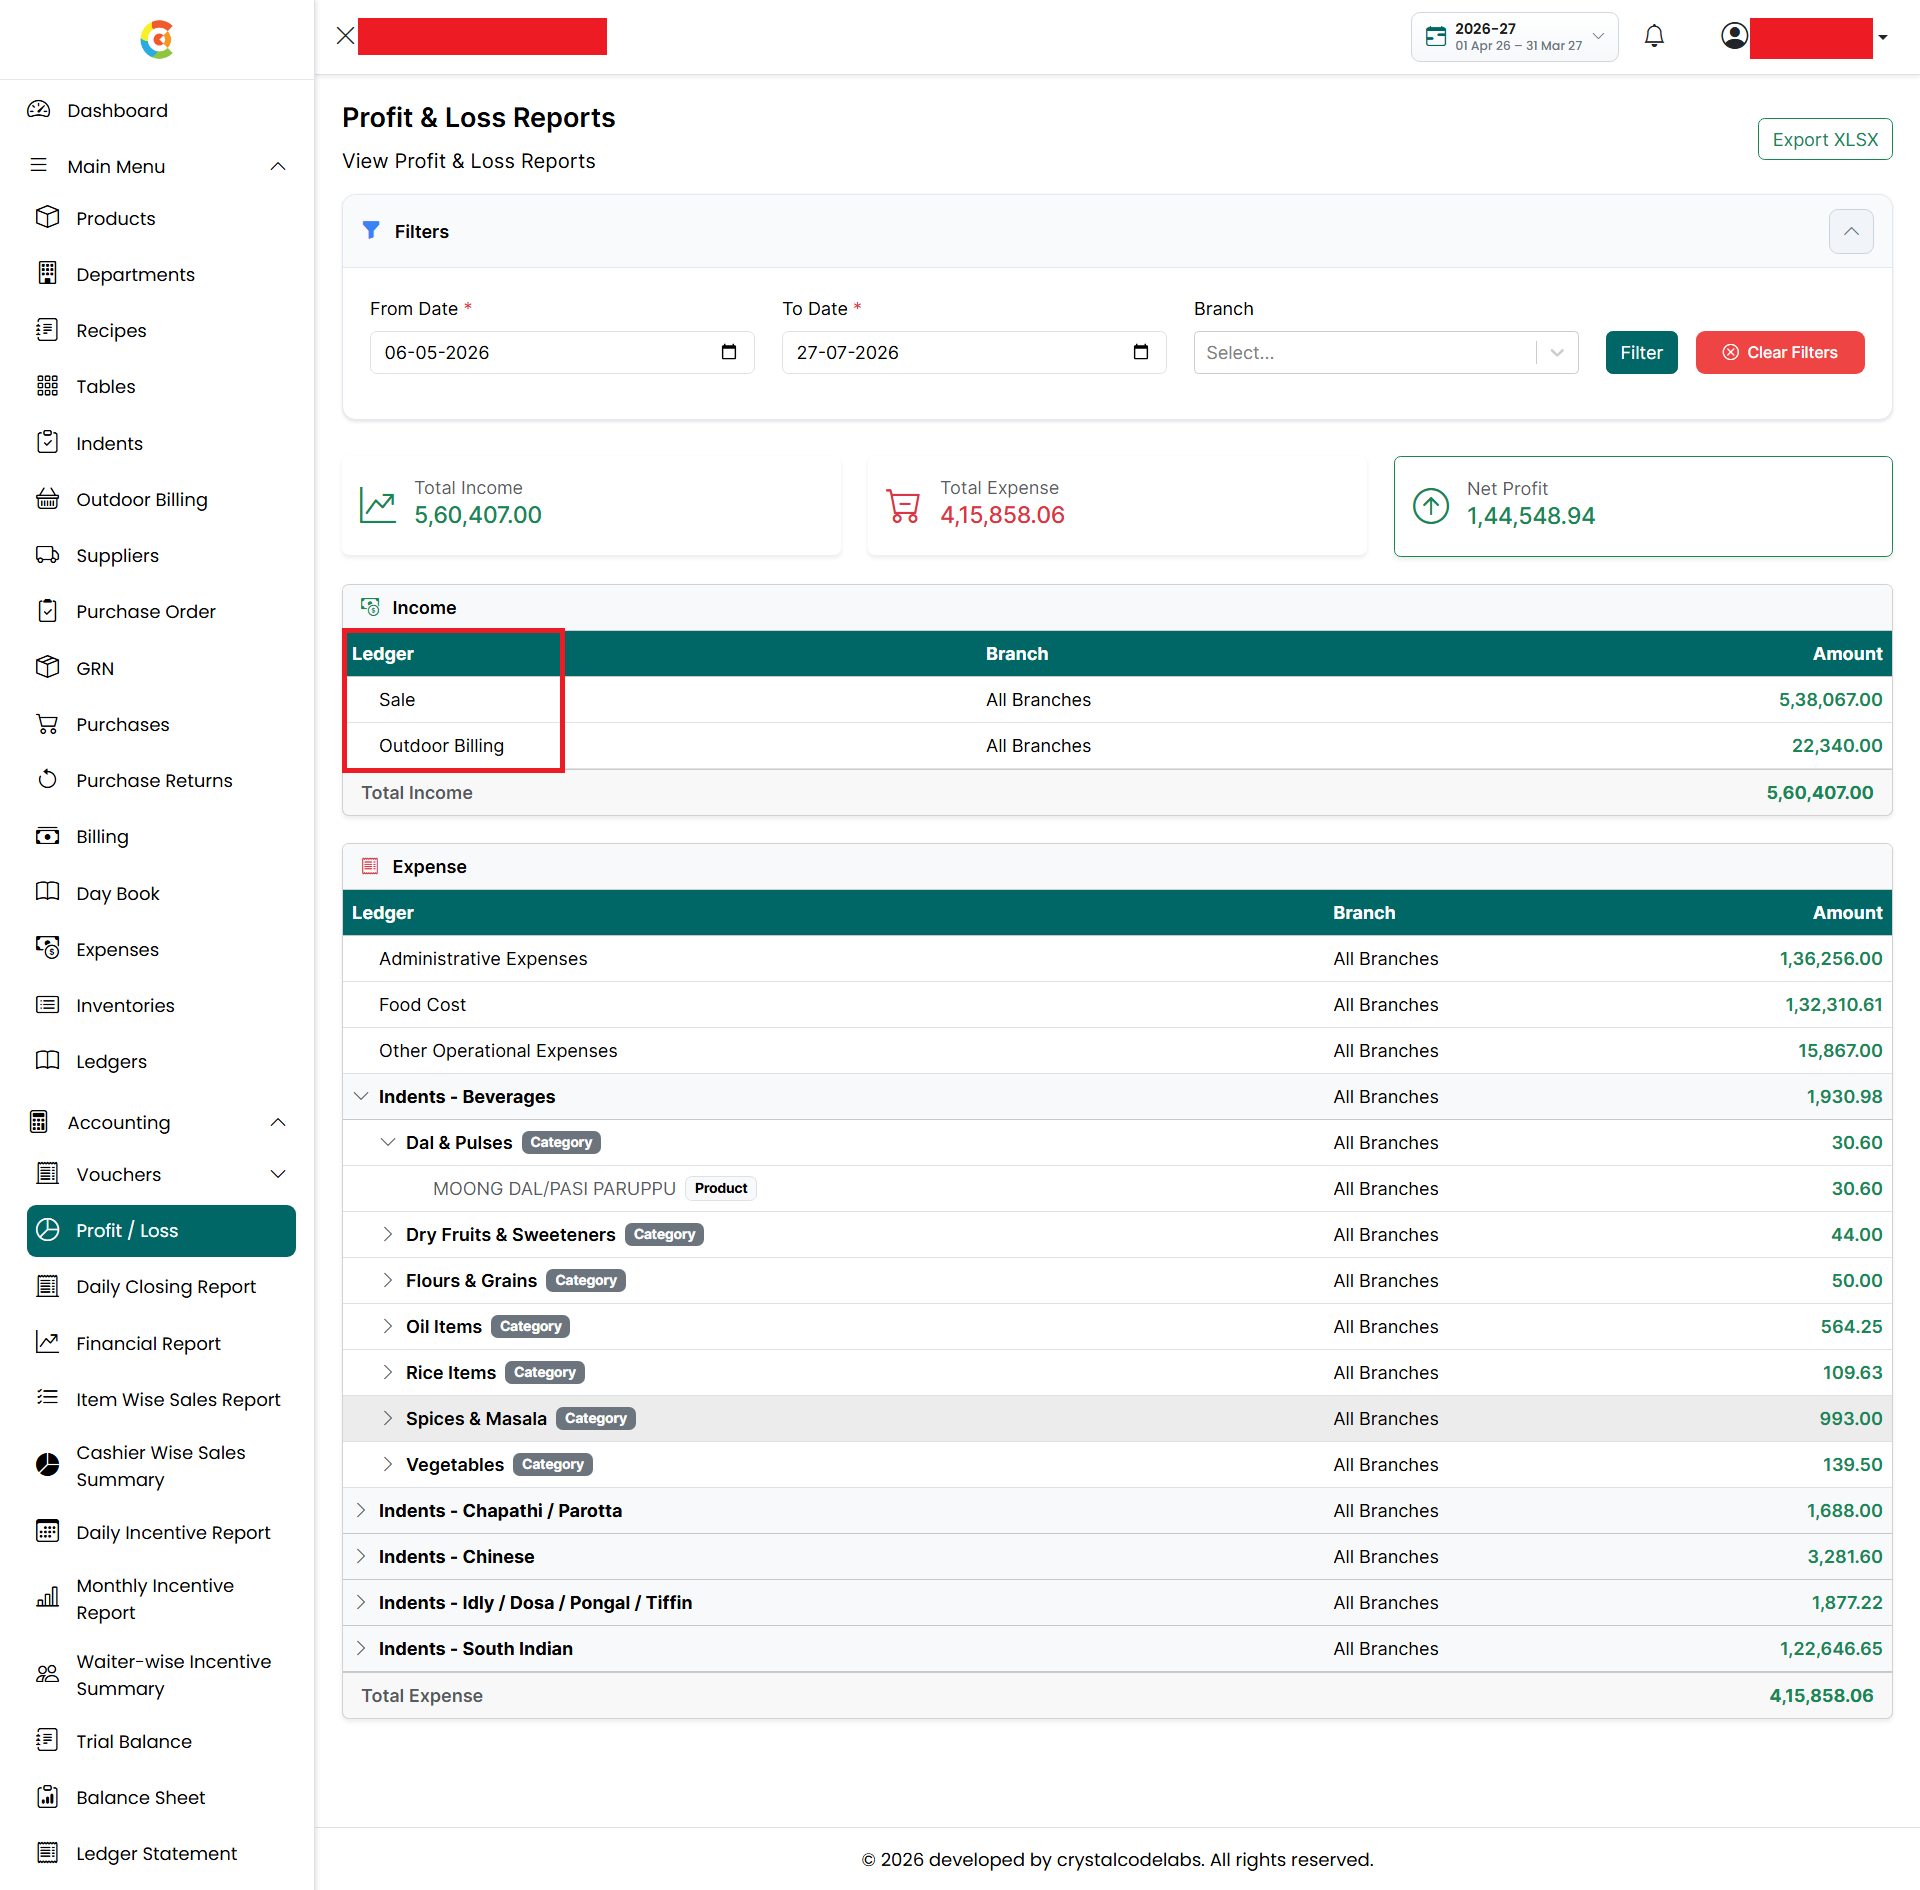
- The Income section displays the revenue earned during the selected period. Each income record displays the following information:
- Ledger - Displays the income source.
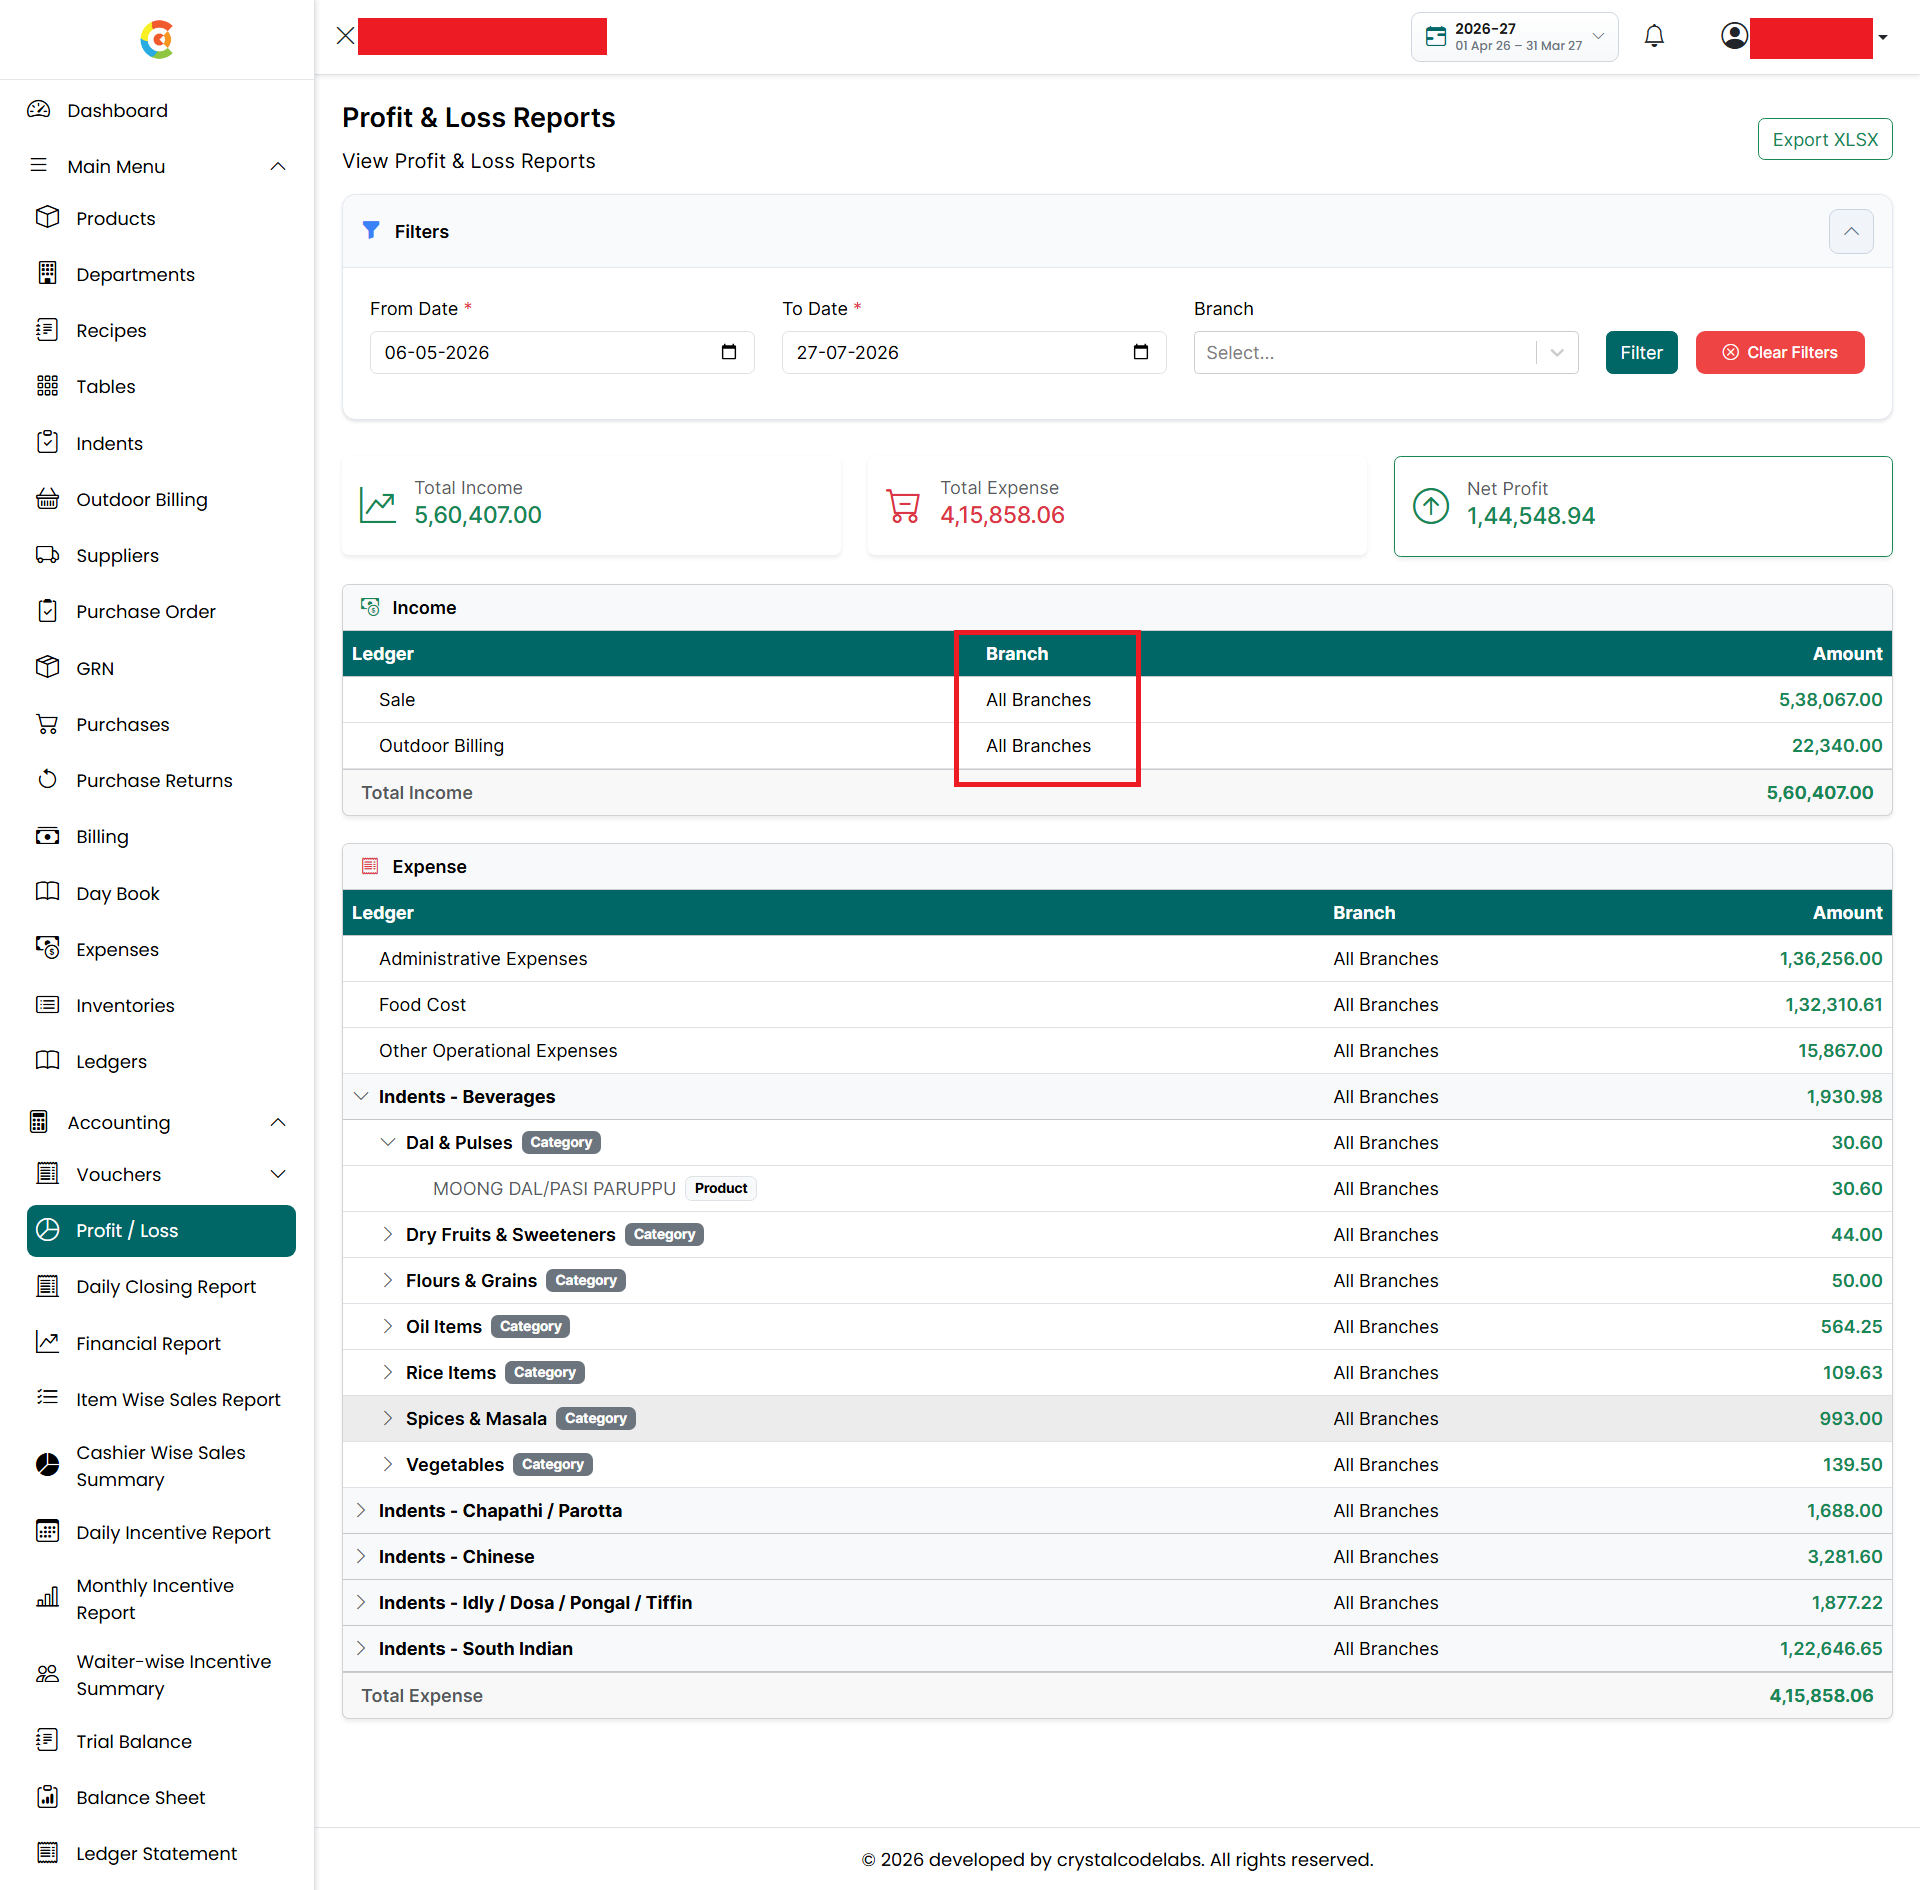
- Branch - Displays the branch associated with the income.
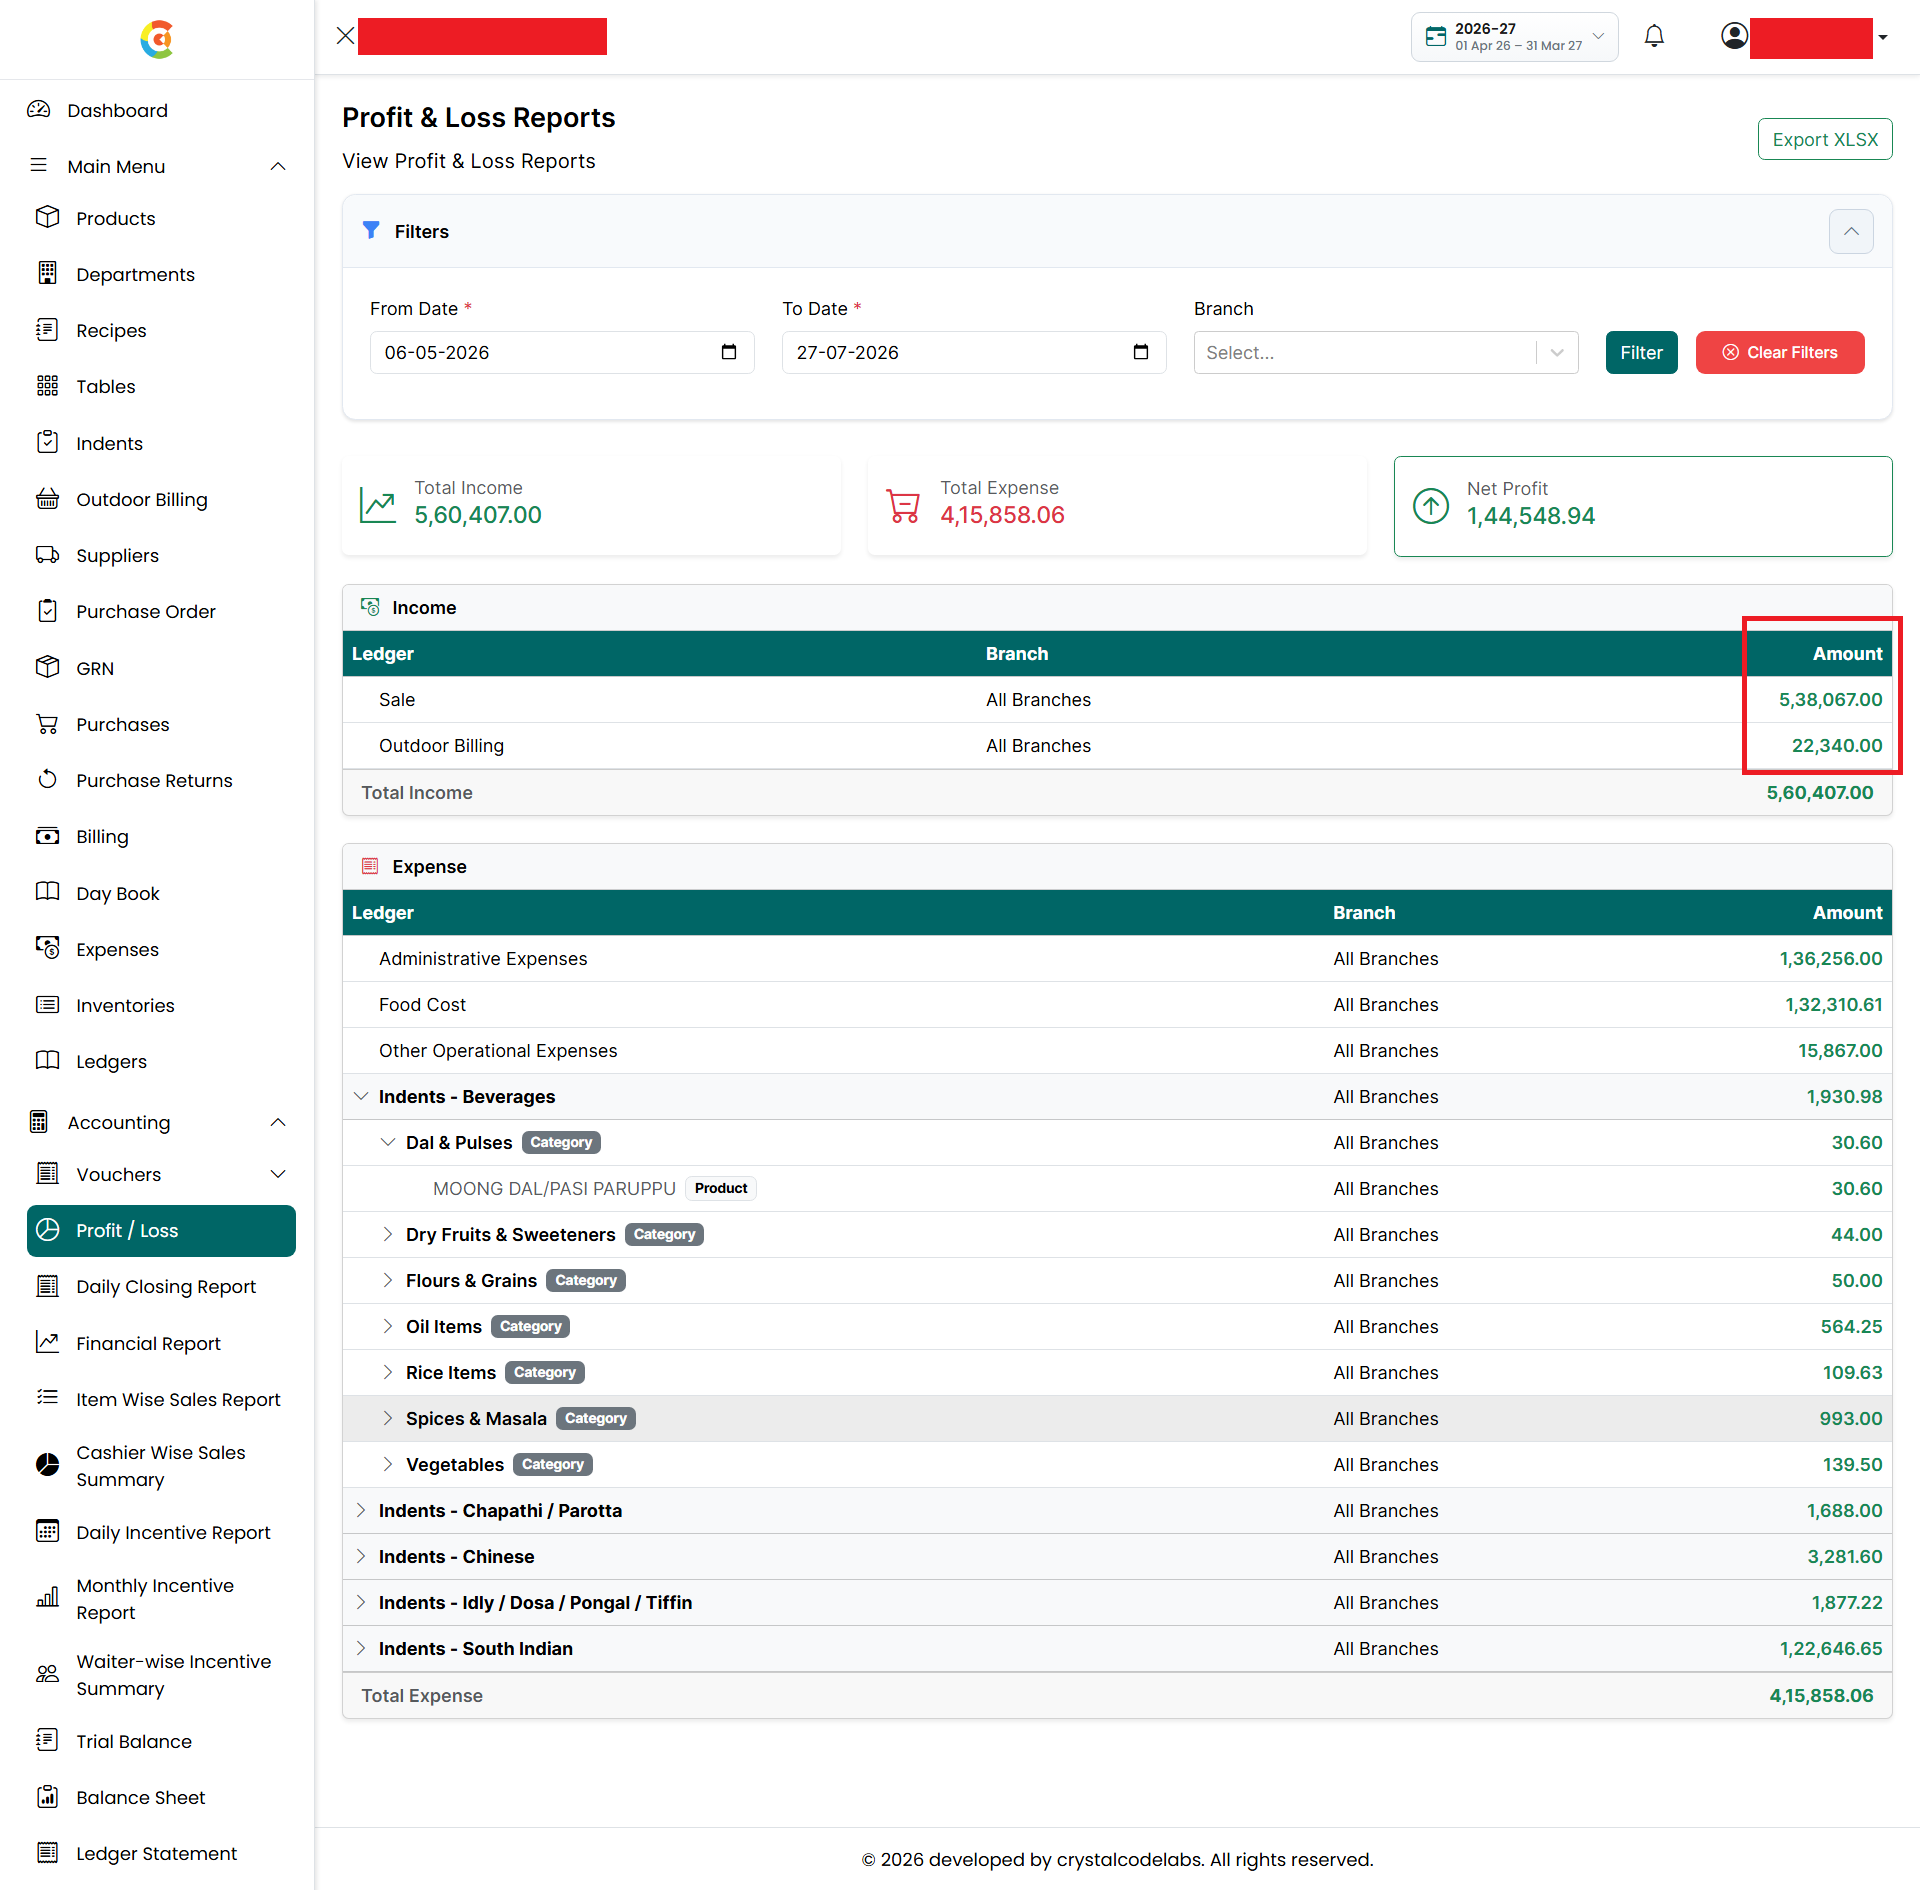
- Amount - Displays the total income amount.
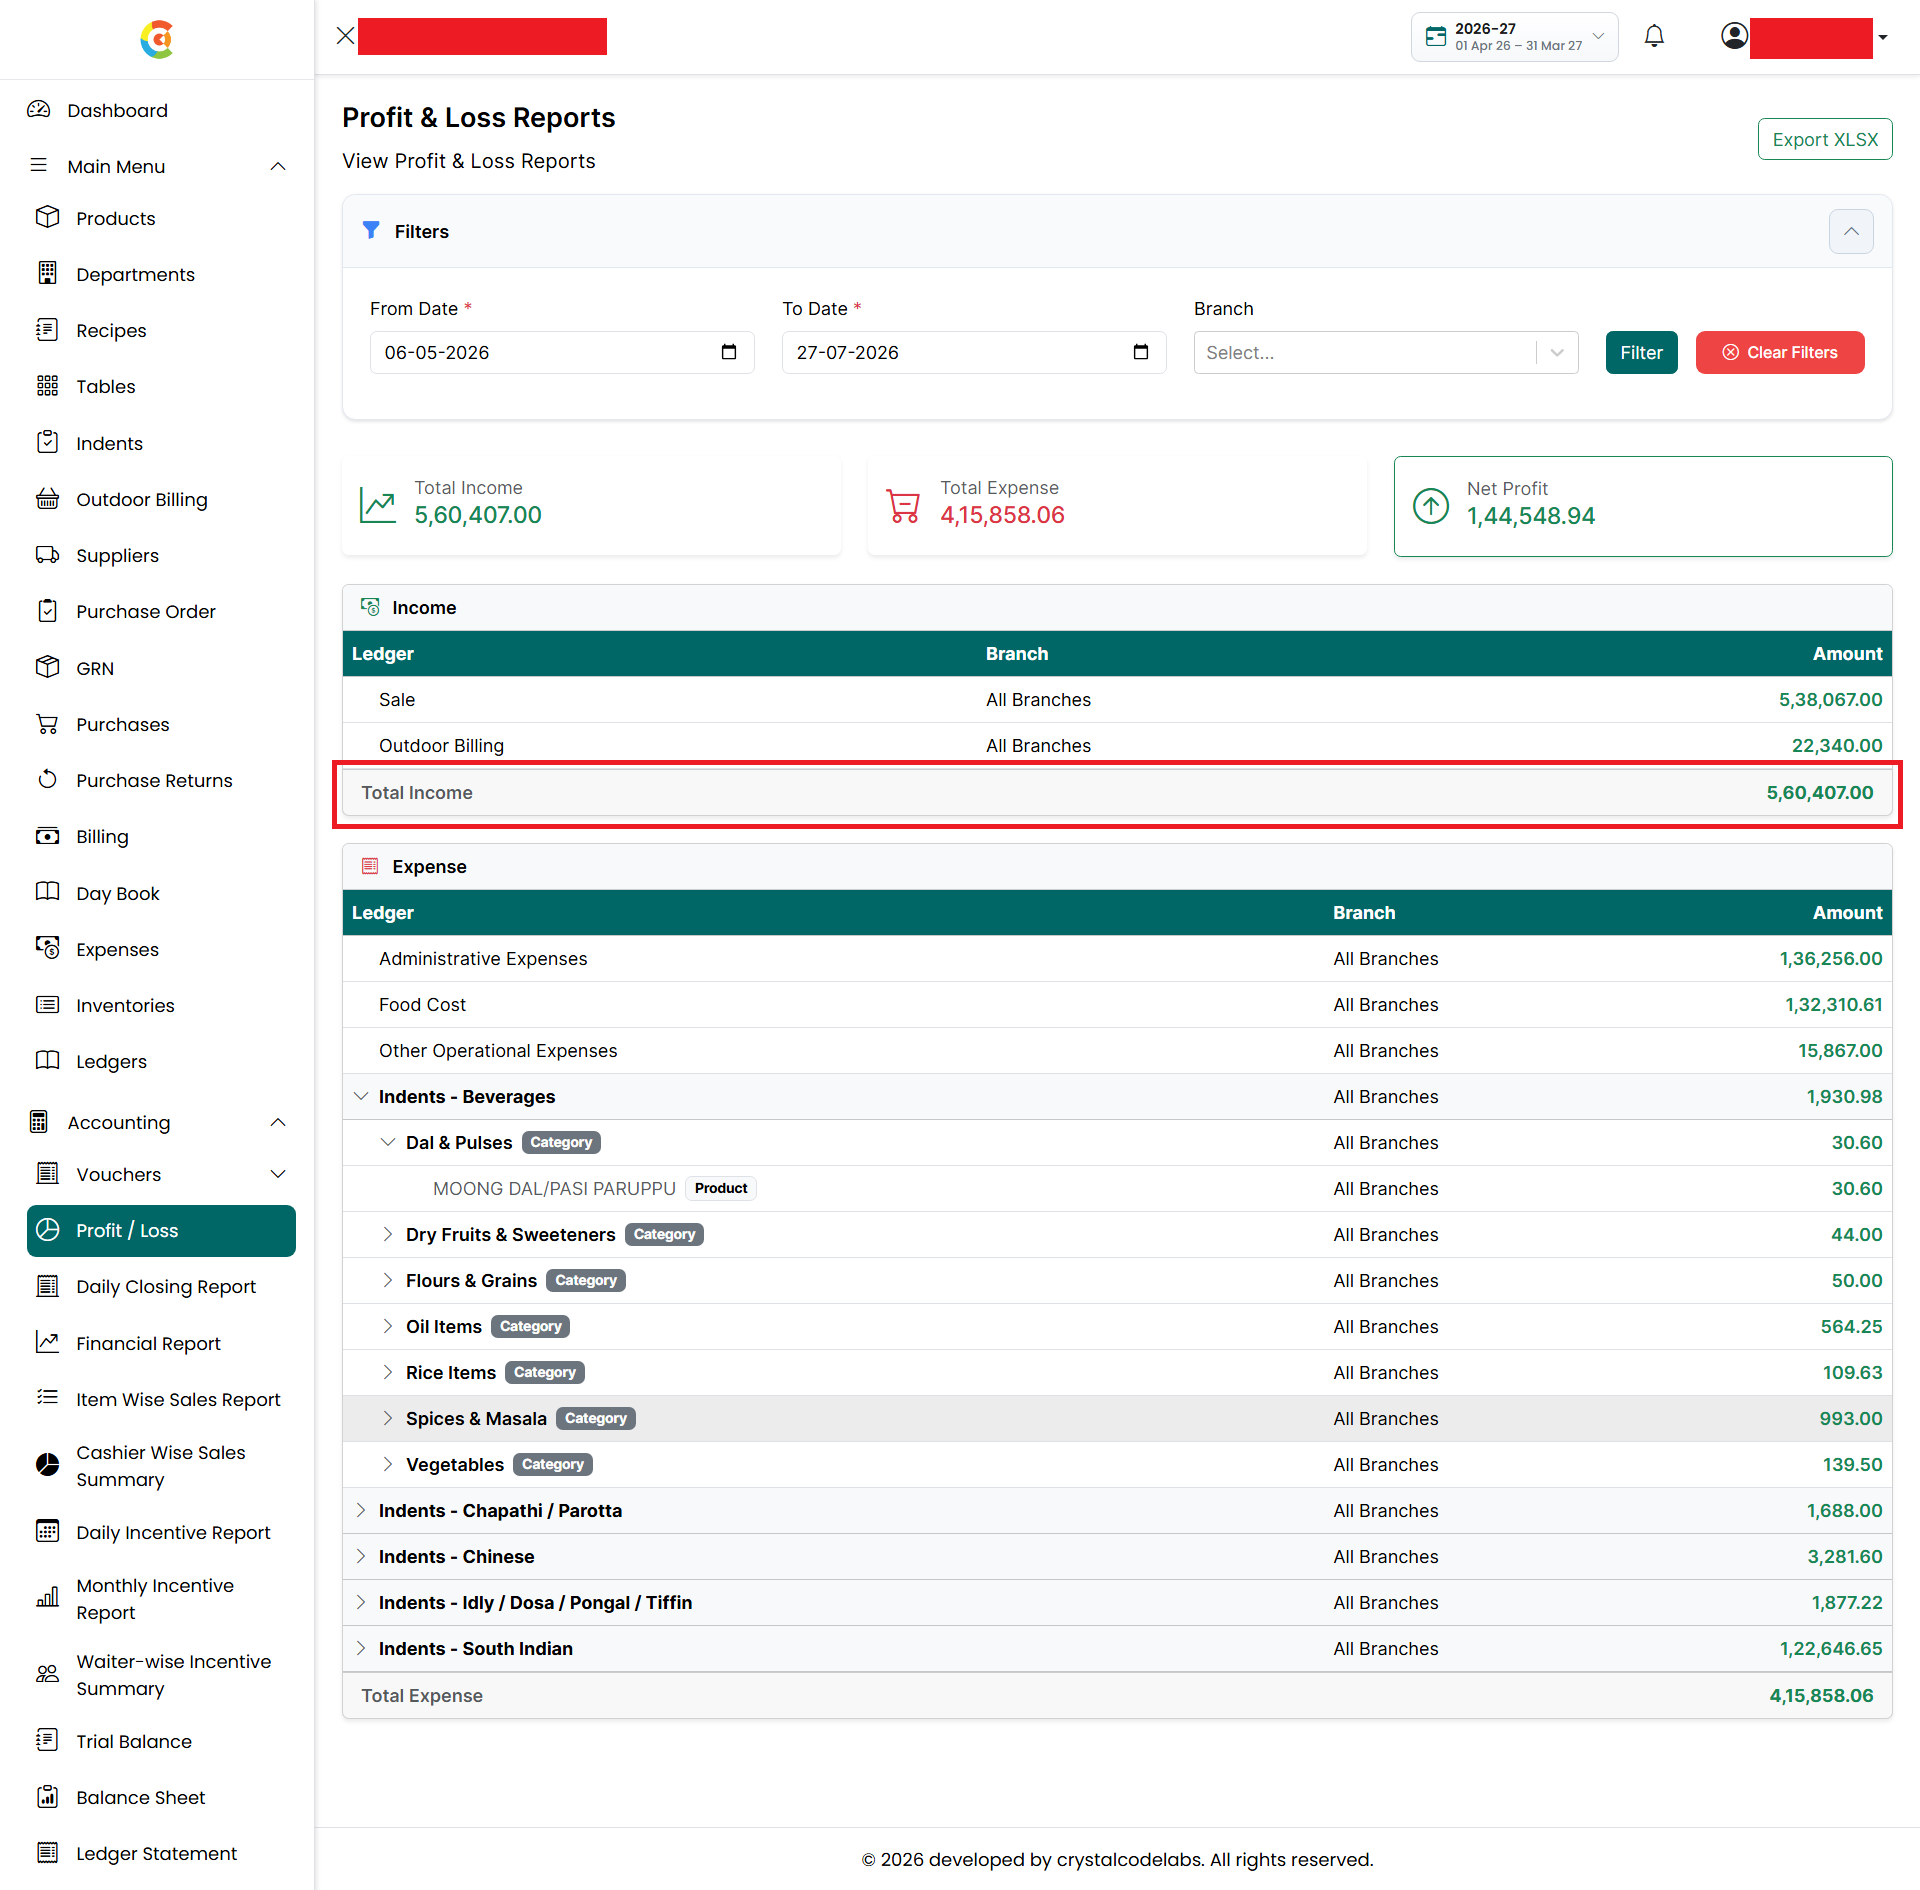
- The report also displays Total Income at the bottom of the Income section.
- Note: For the Restaurant Vertical, income is calculated from:
- Sales
- Outdoor Billing
- Expense
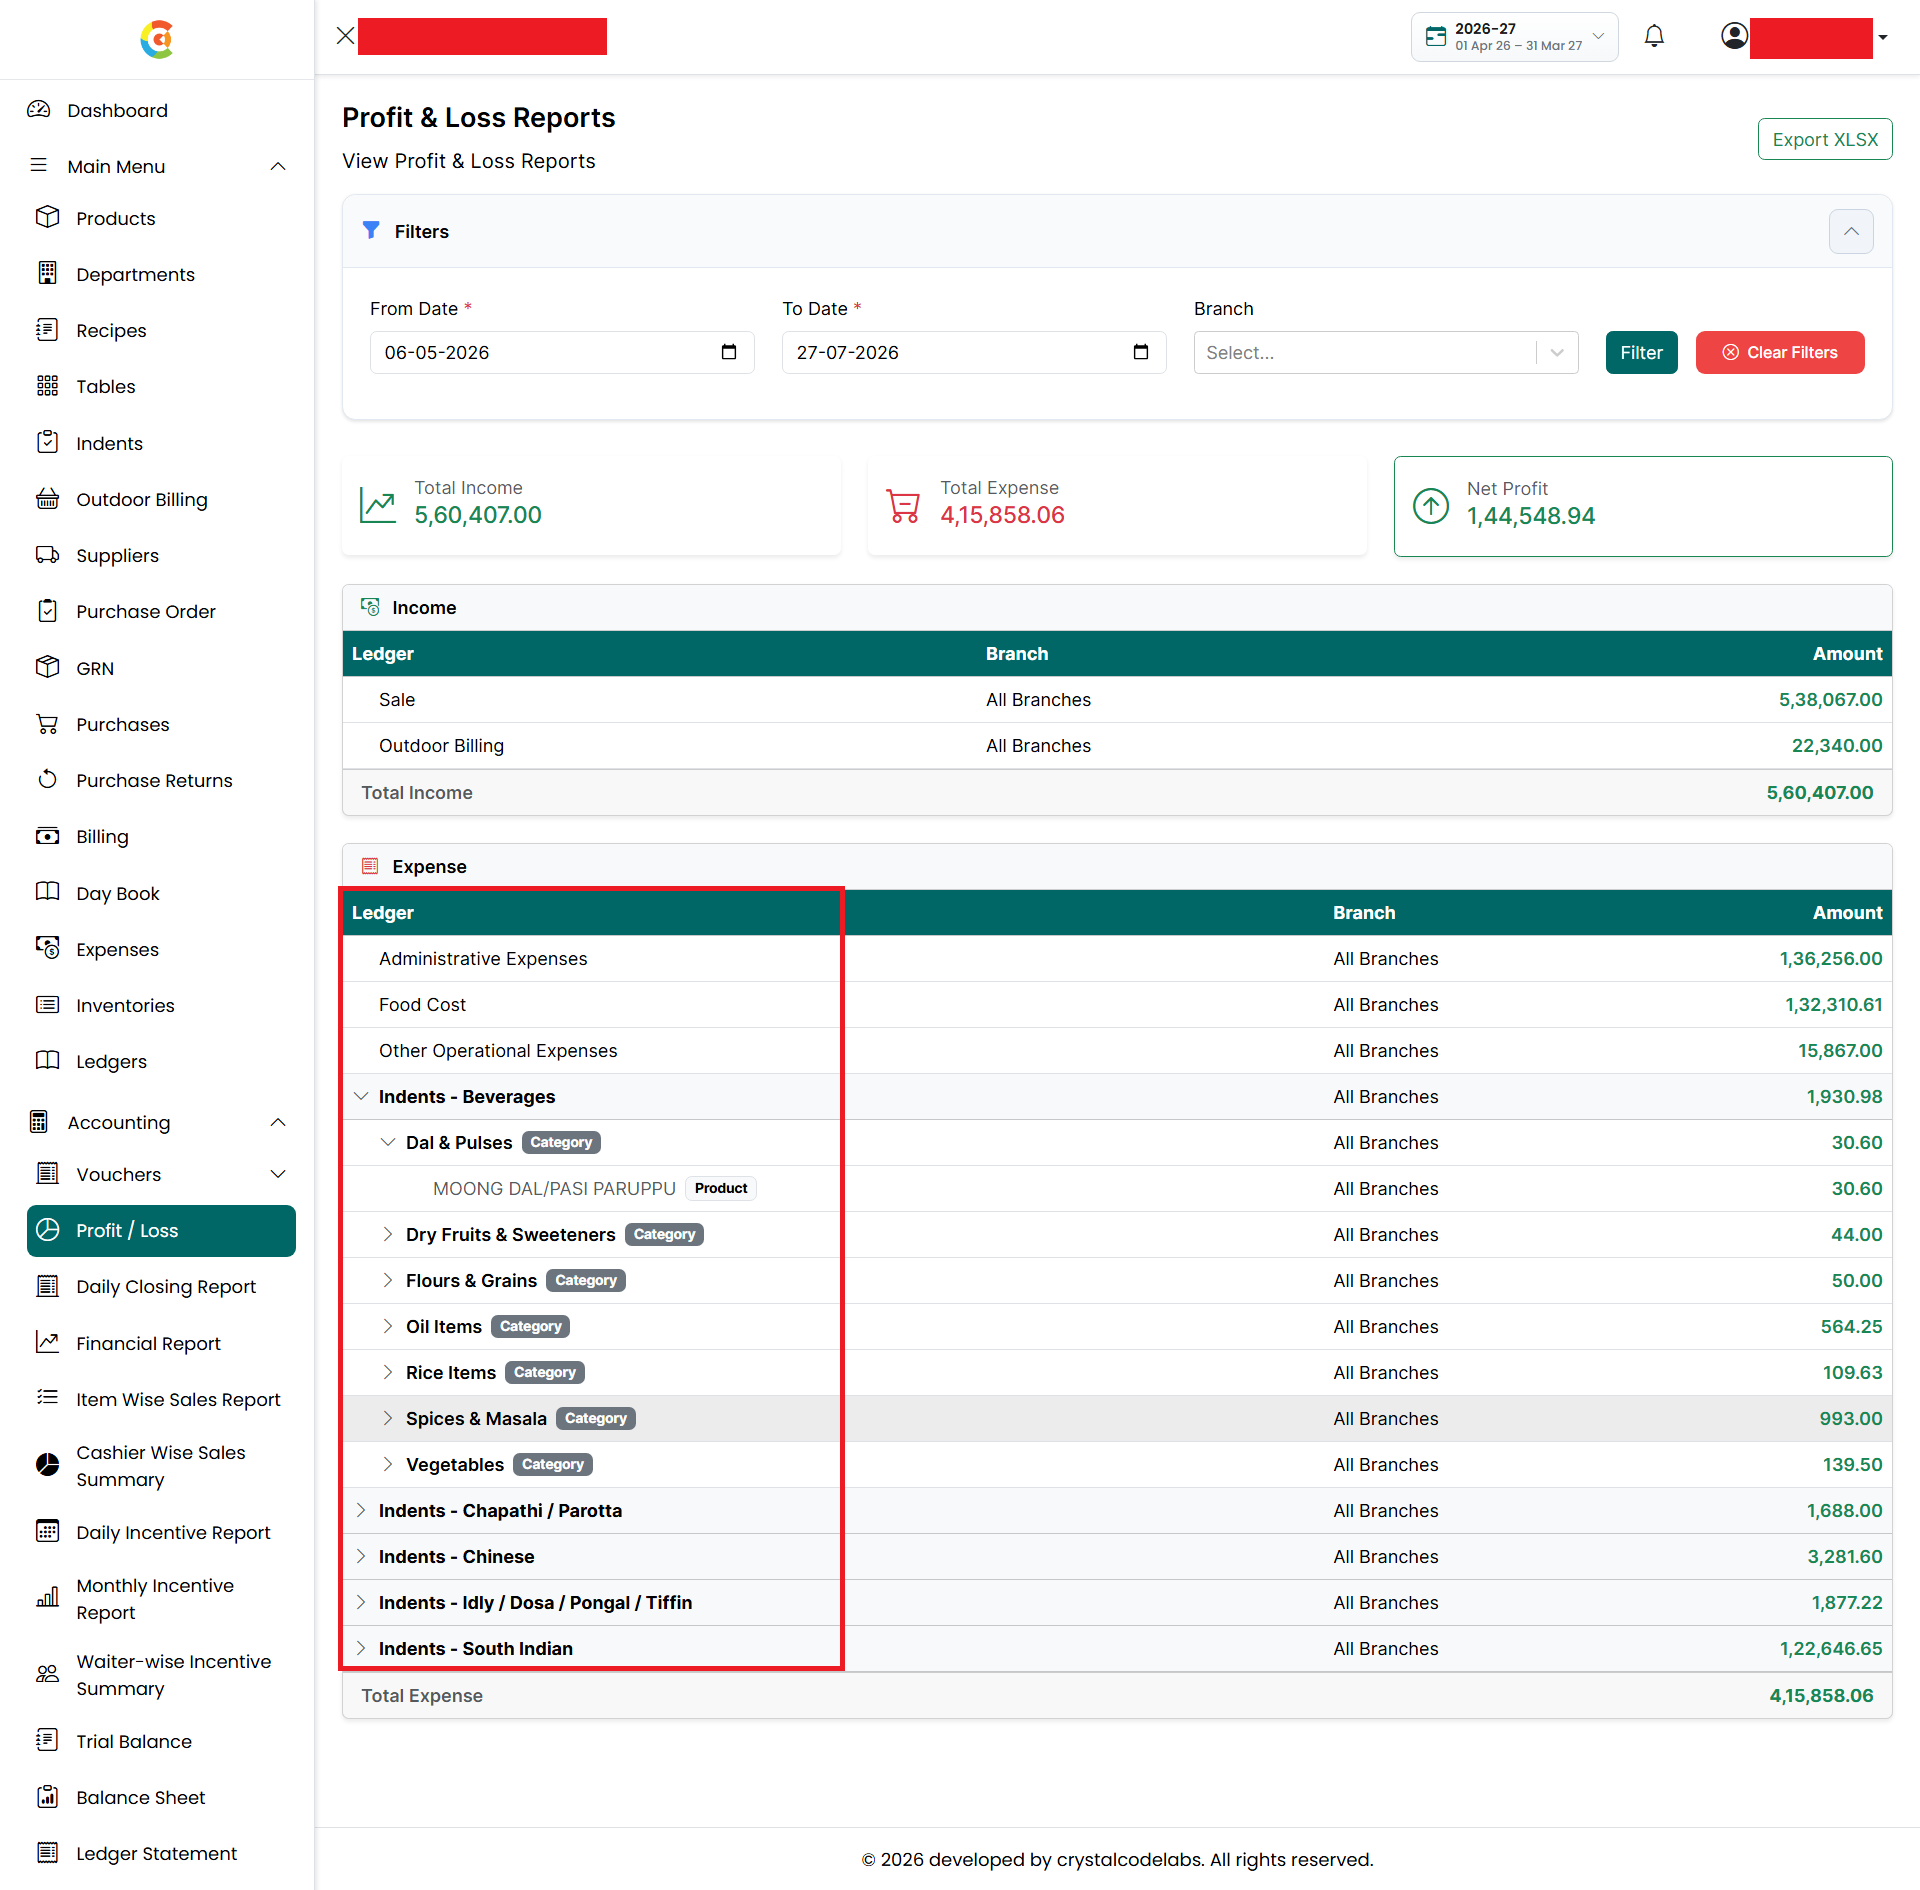
- The Expense section displays all expenses included in the Profit & Loss calculation. Each expense record displays the following information:
- Ledger / Department
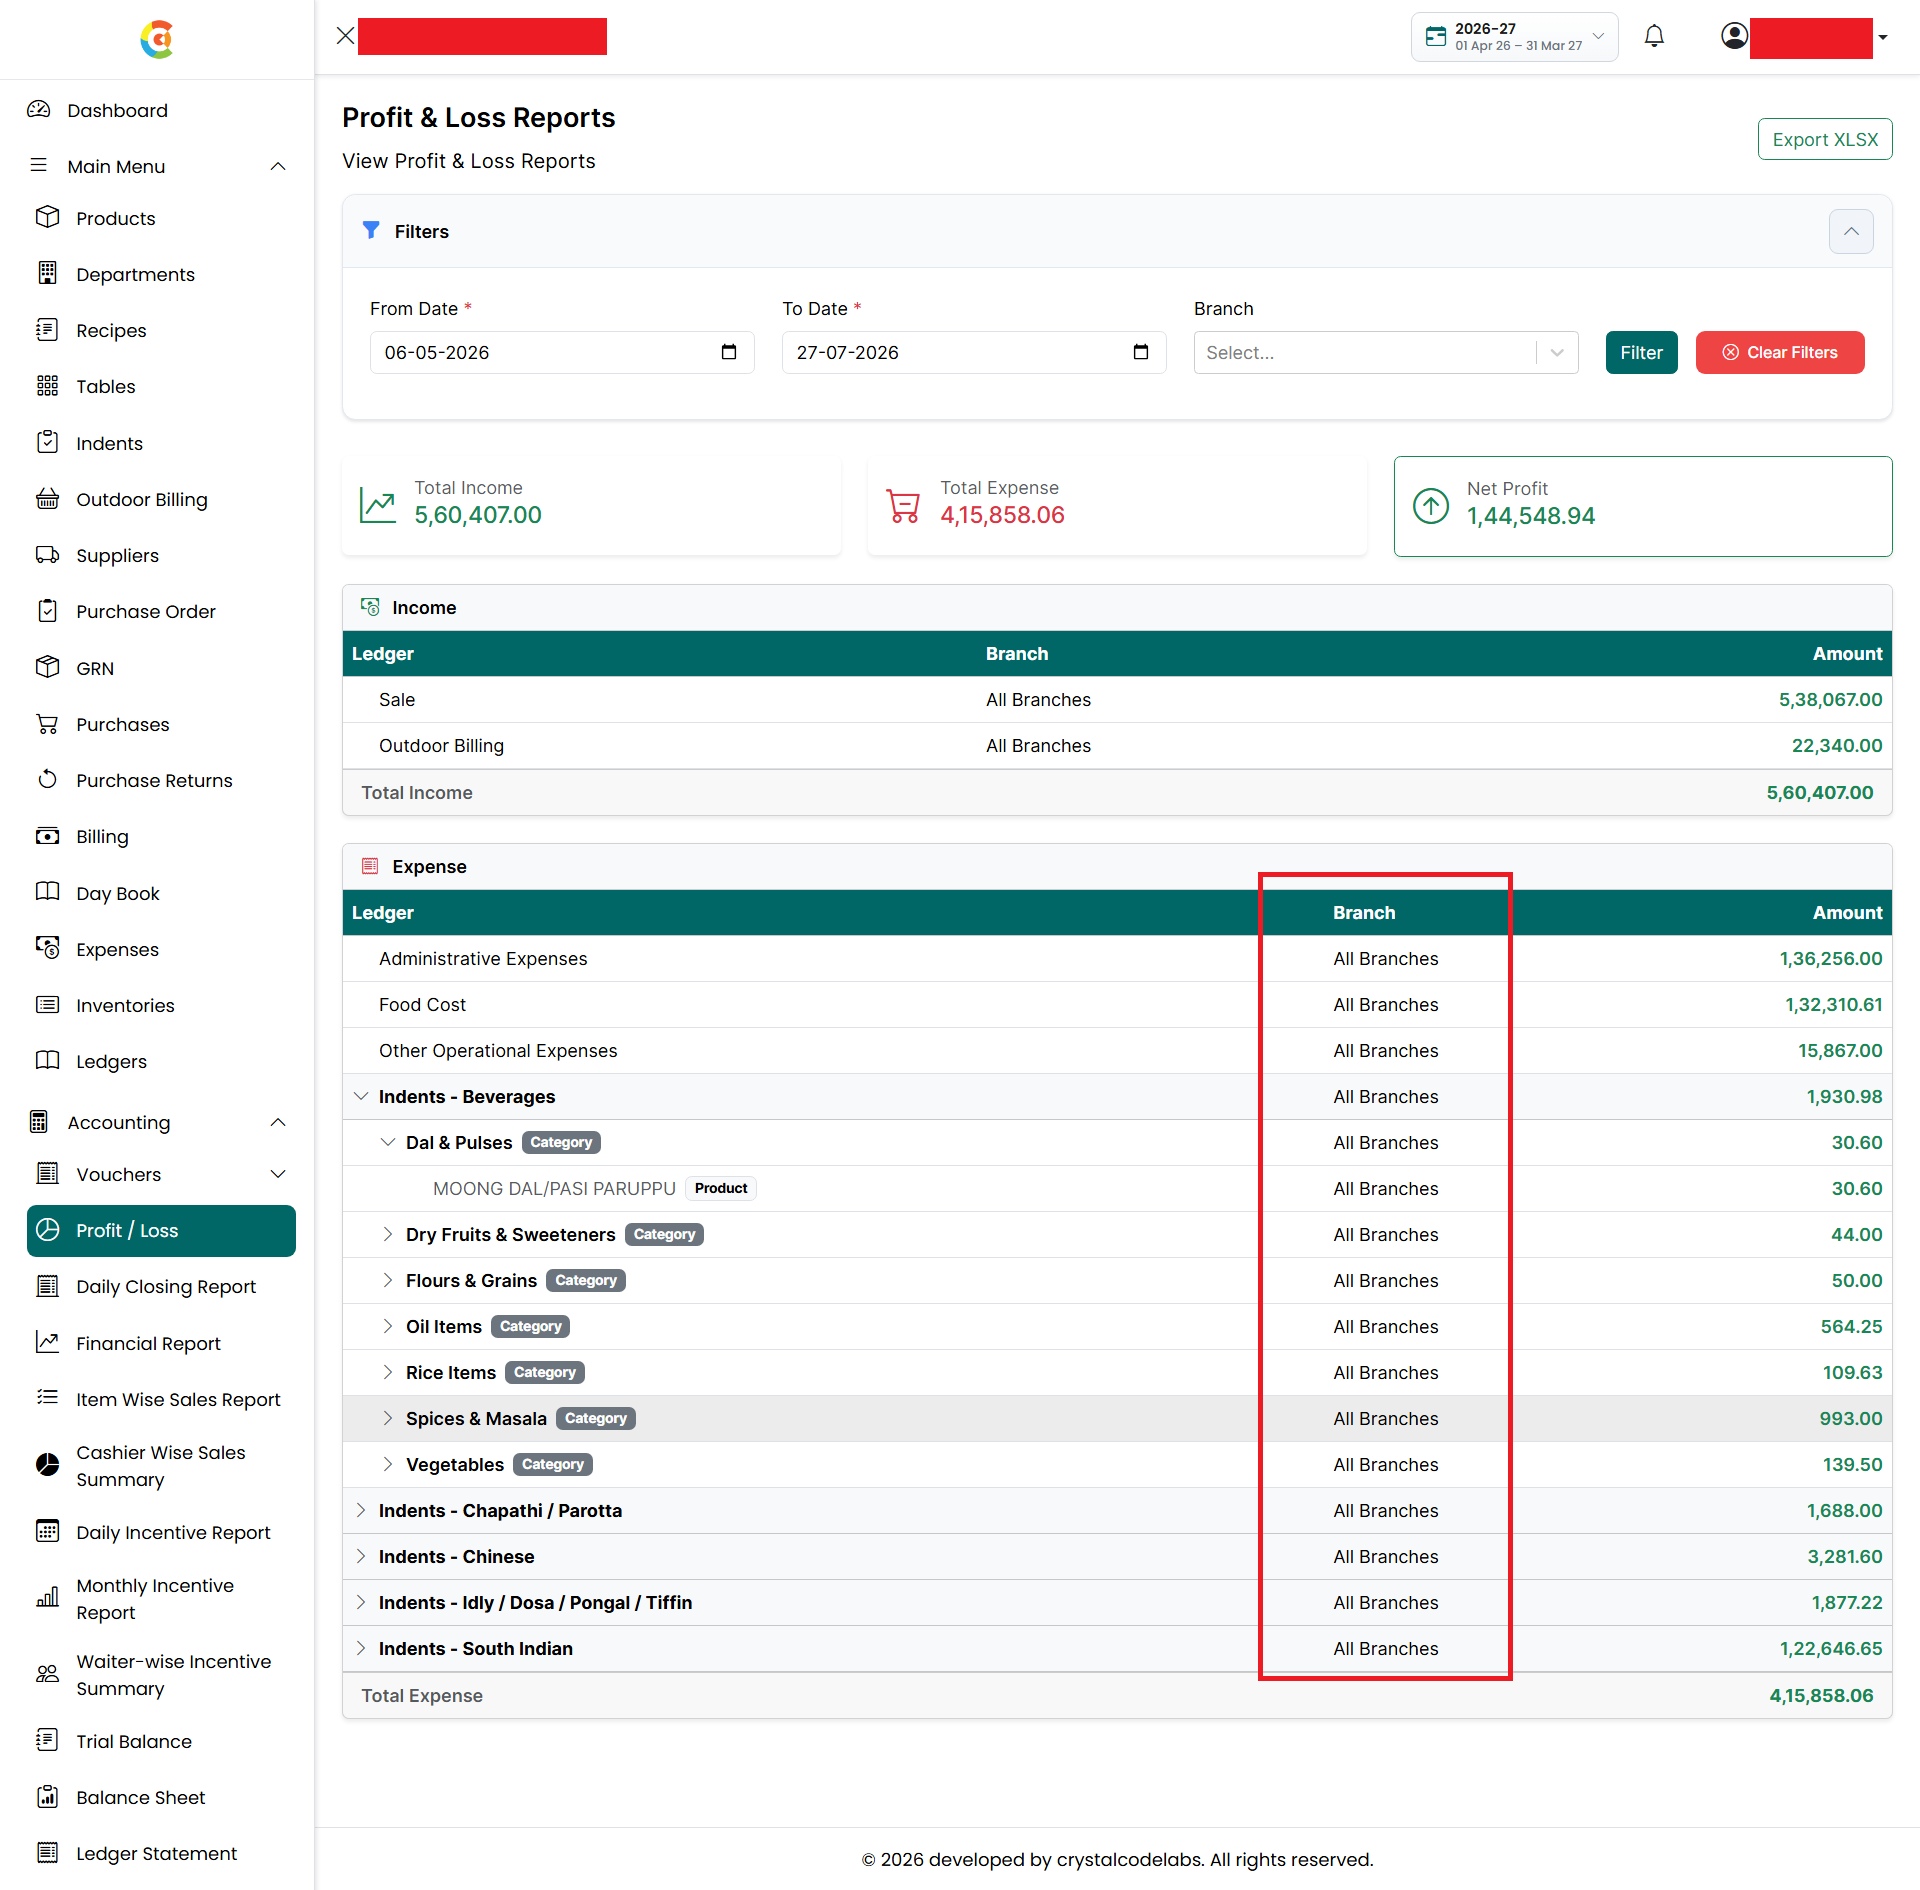
- Branch
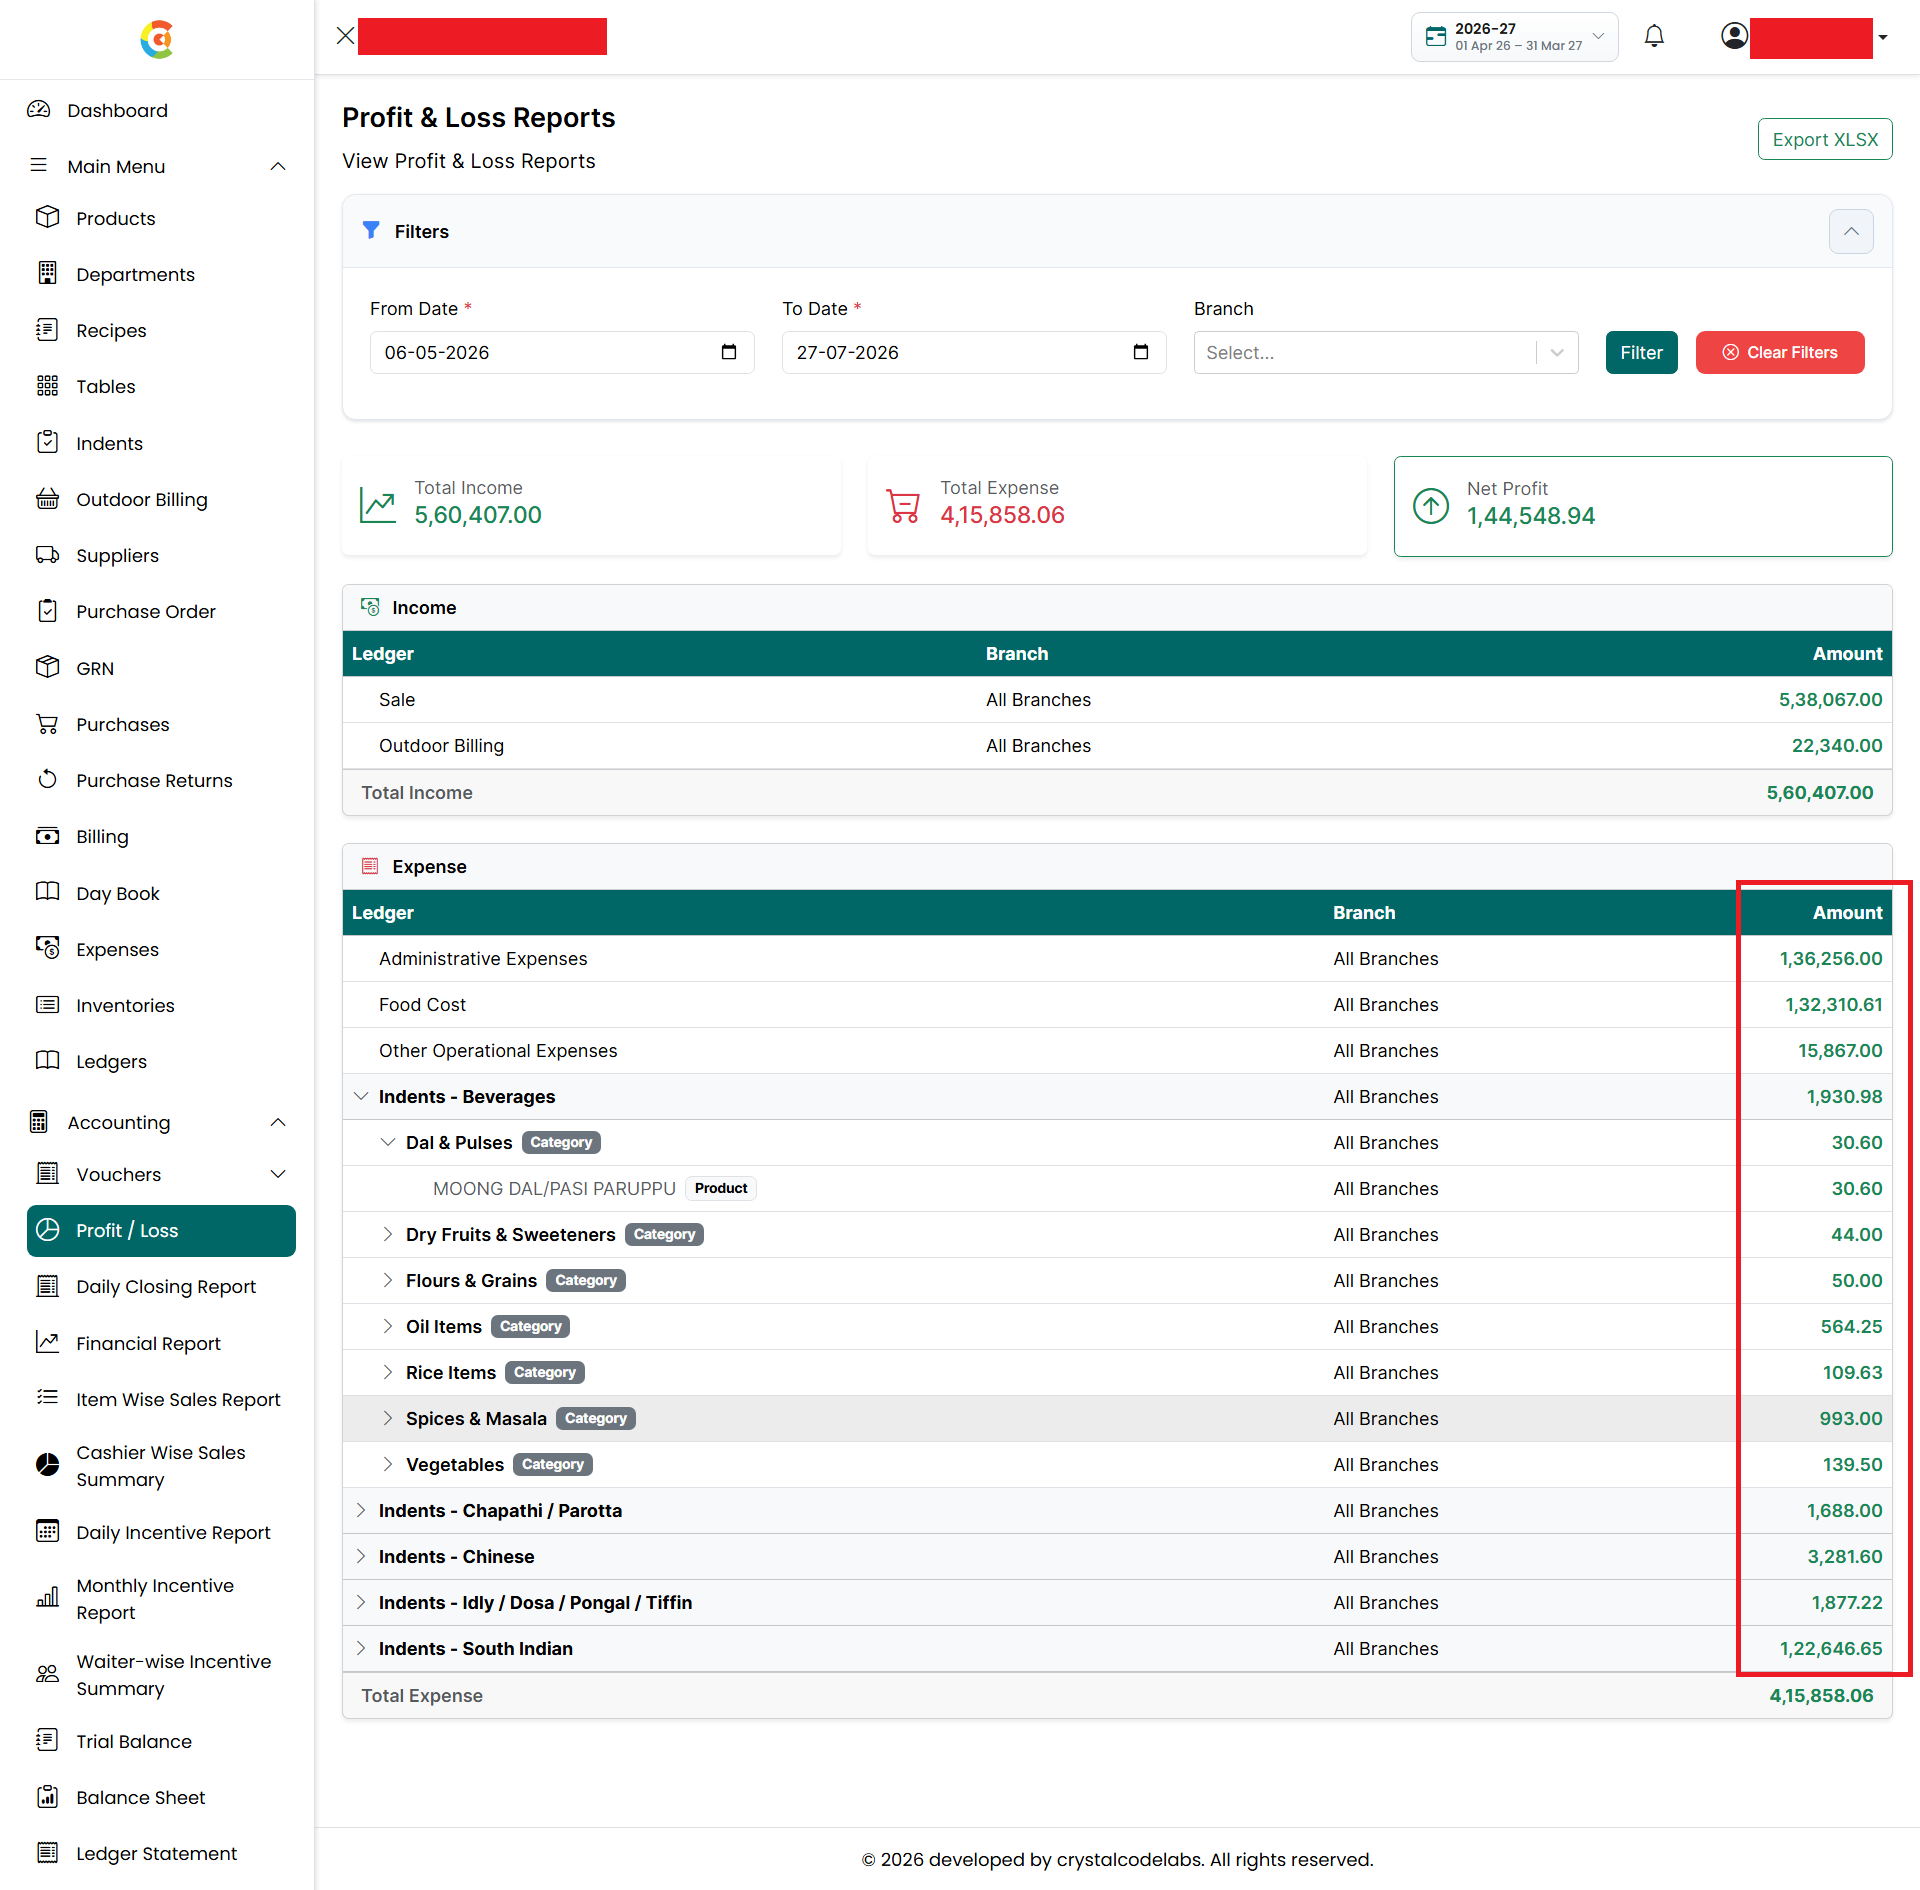
- Amount
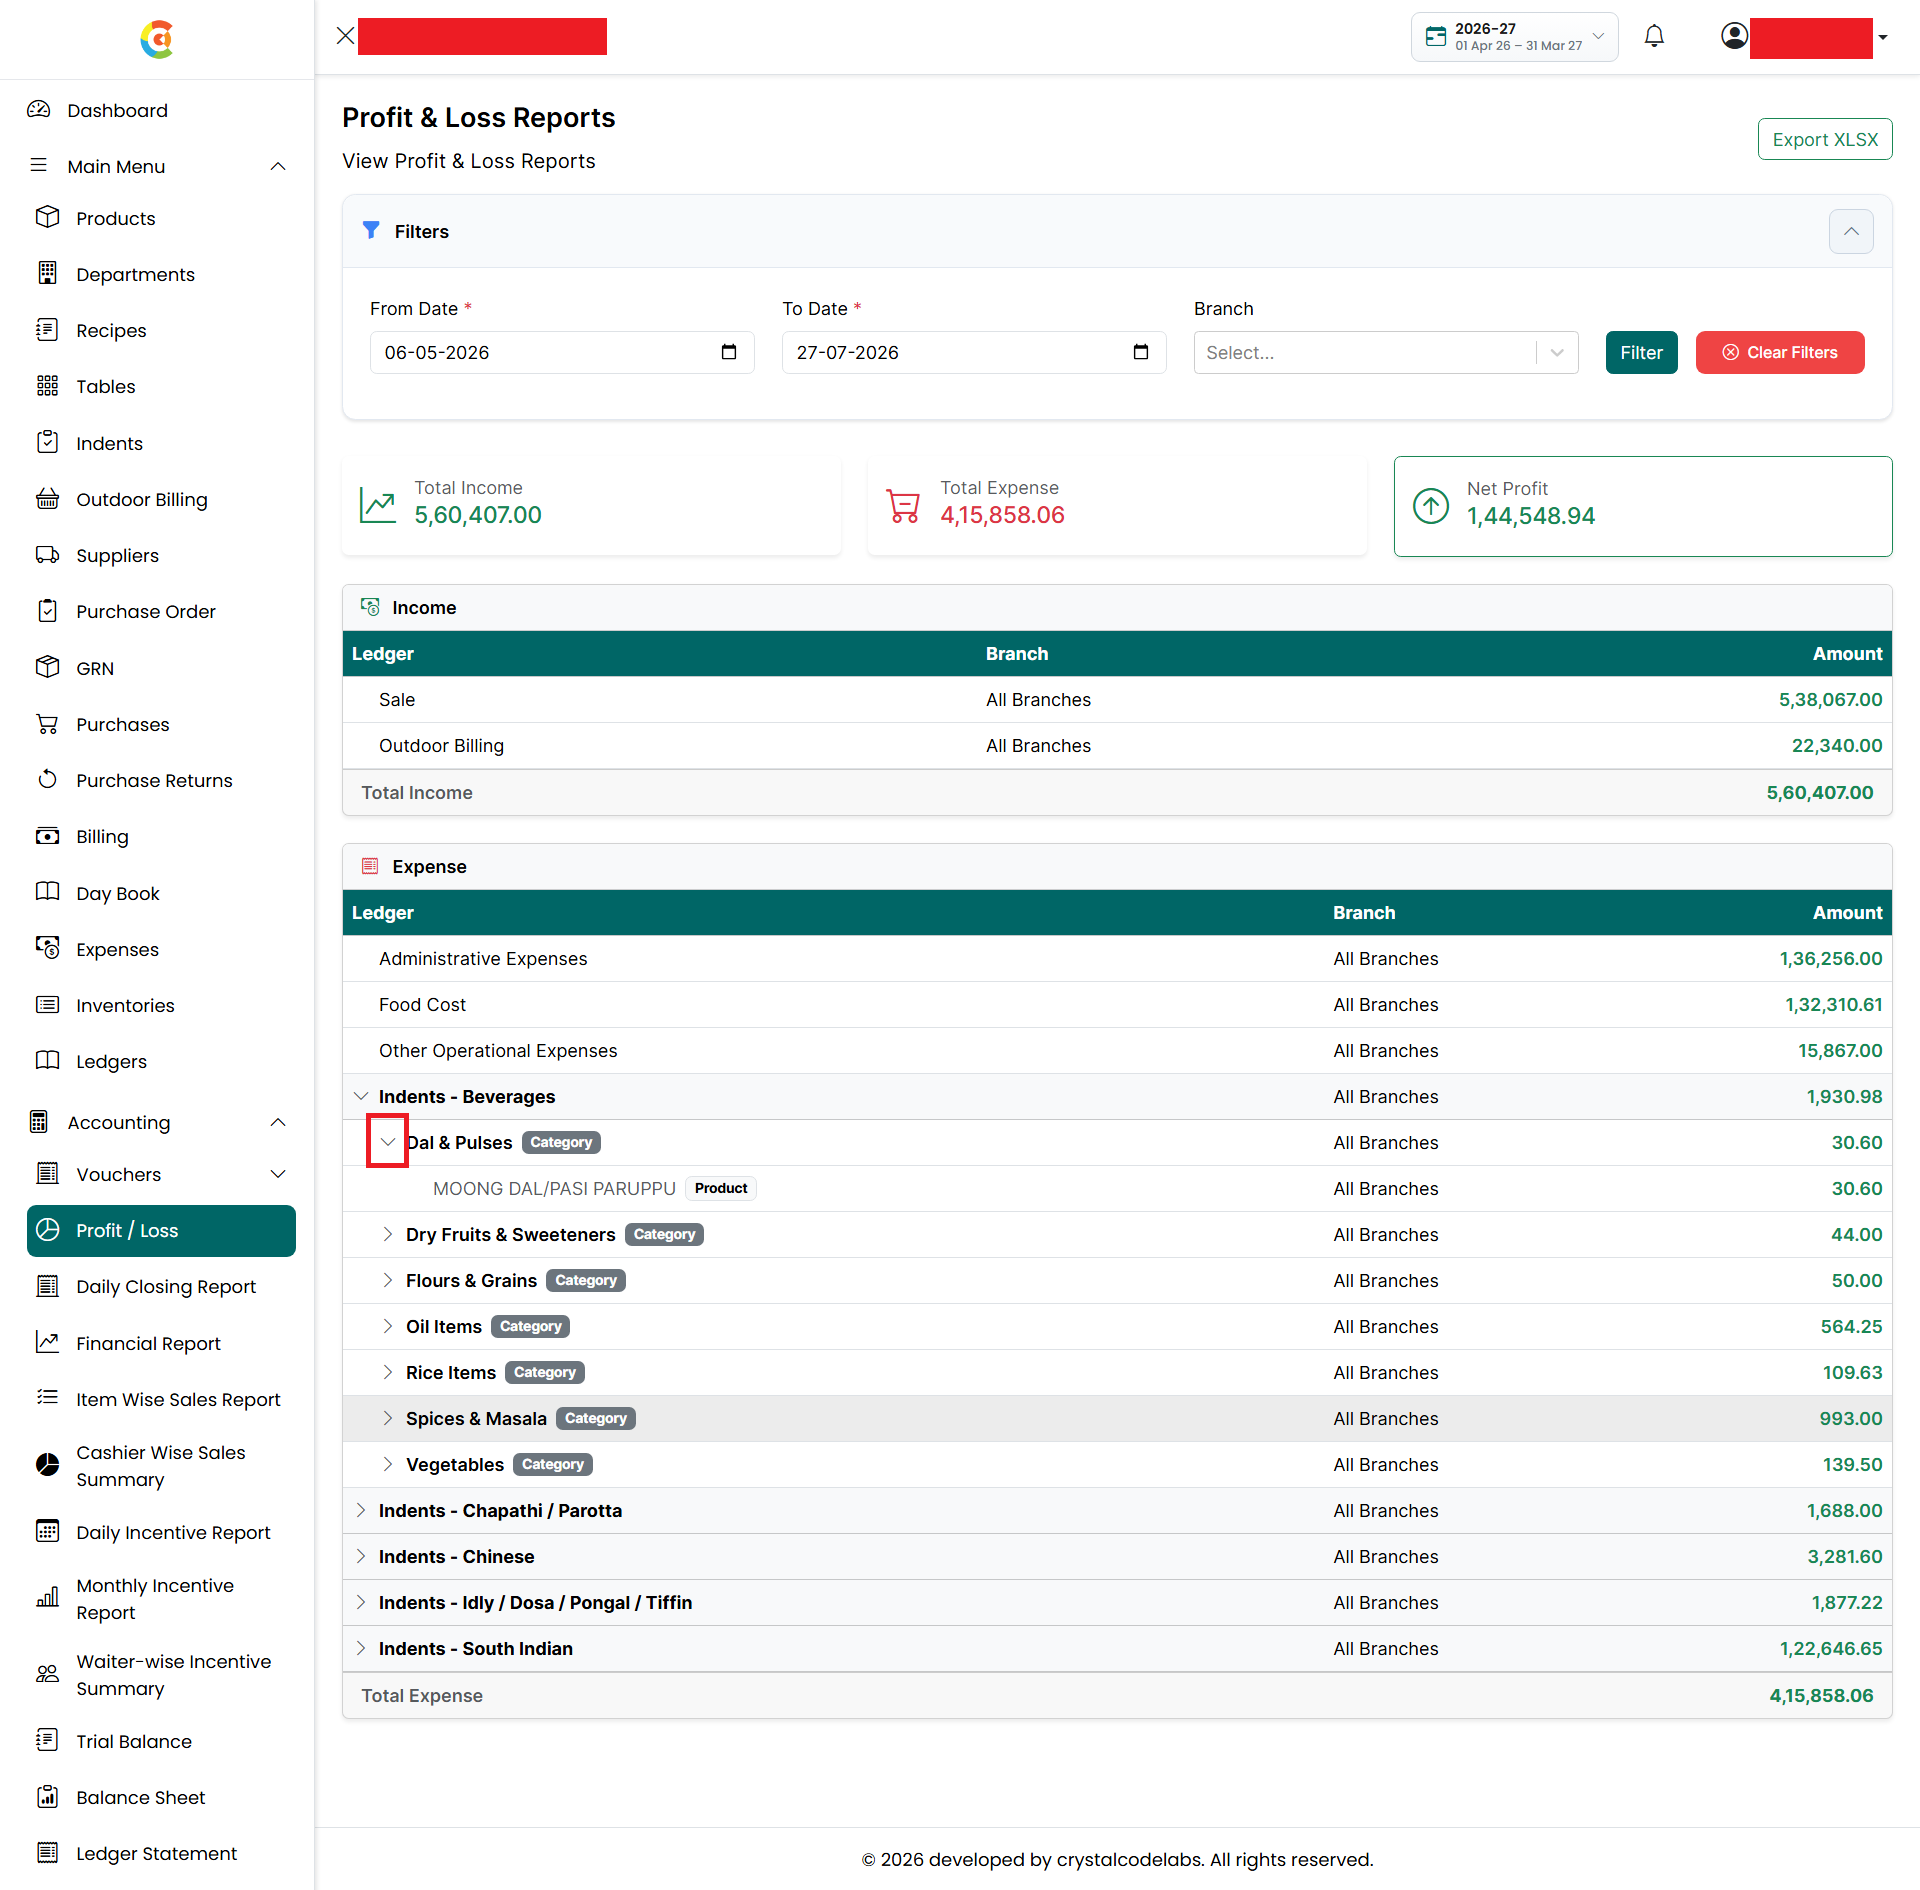
- Expenses are organized in a hierarchical structure that allows you to expand or collapse individual levels. The hierarchy is displayed as follows:
- Department
- Category
- Product
For example:
Indents - South Indian
Vegetables
Onion
Tomato
Green Chilli

- 1. Click the expand (\>) icon to view the categories within a department.
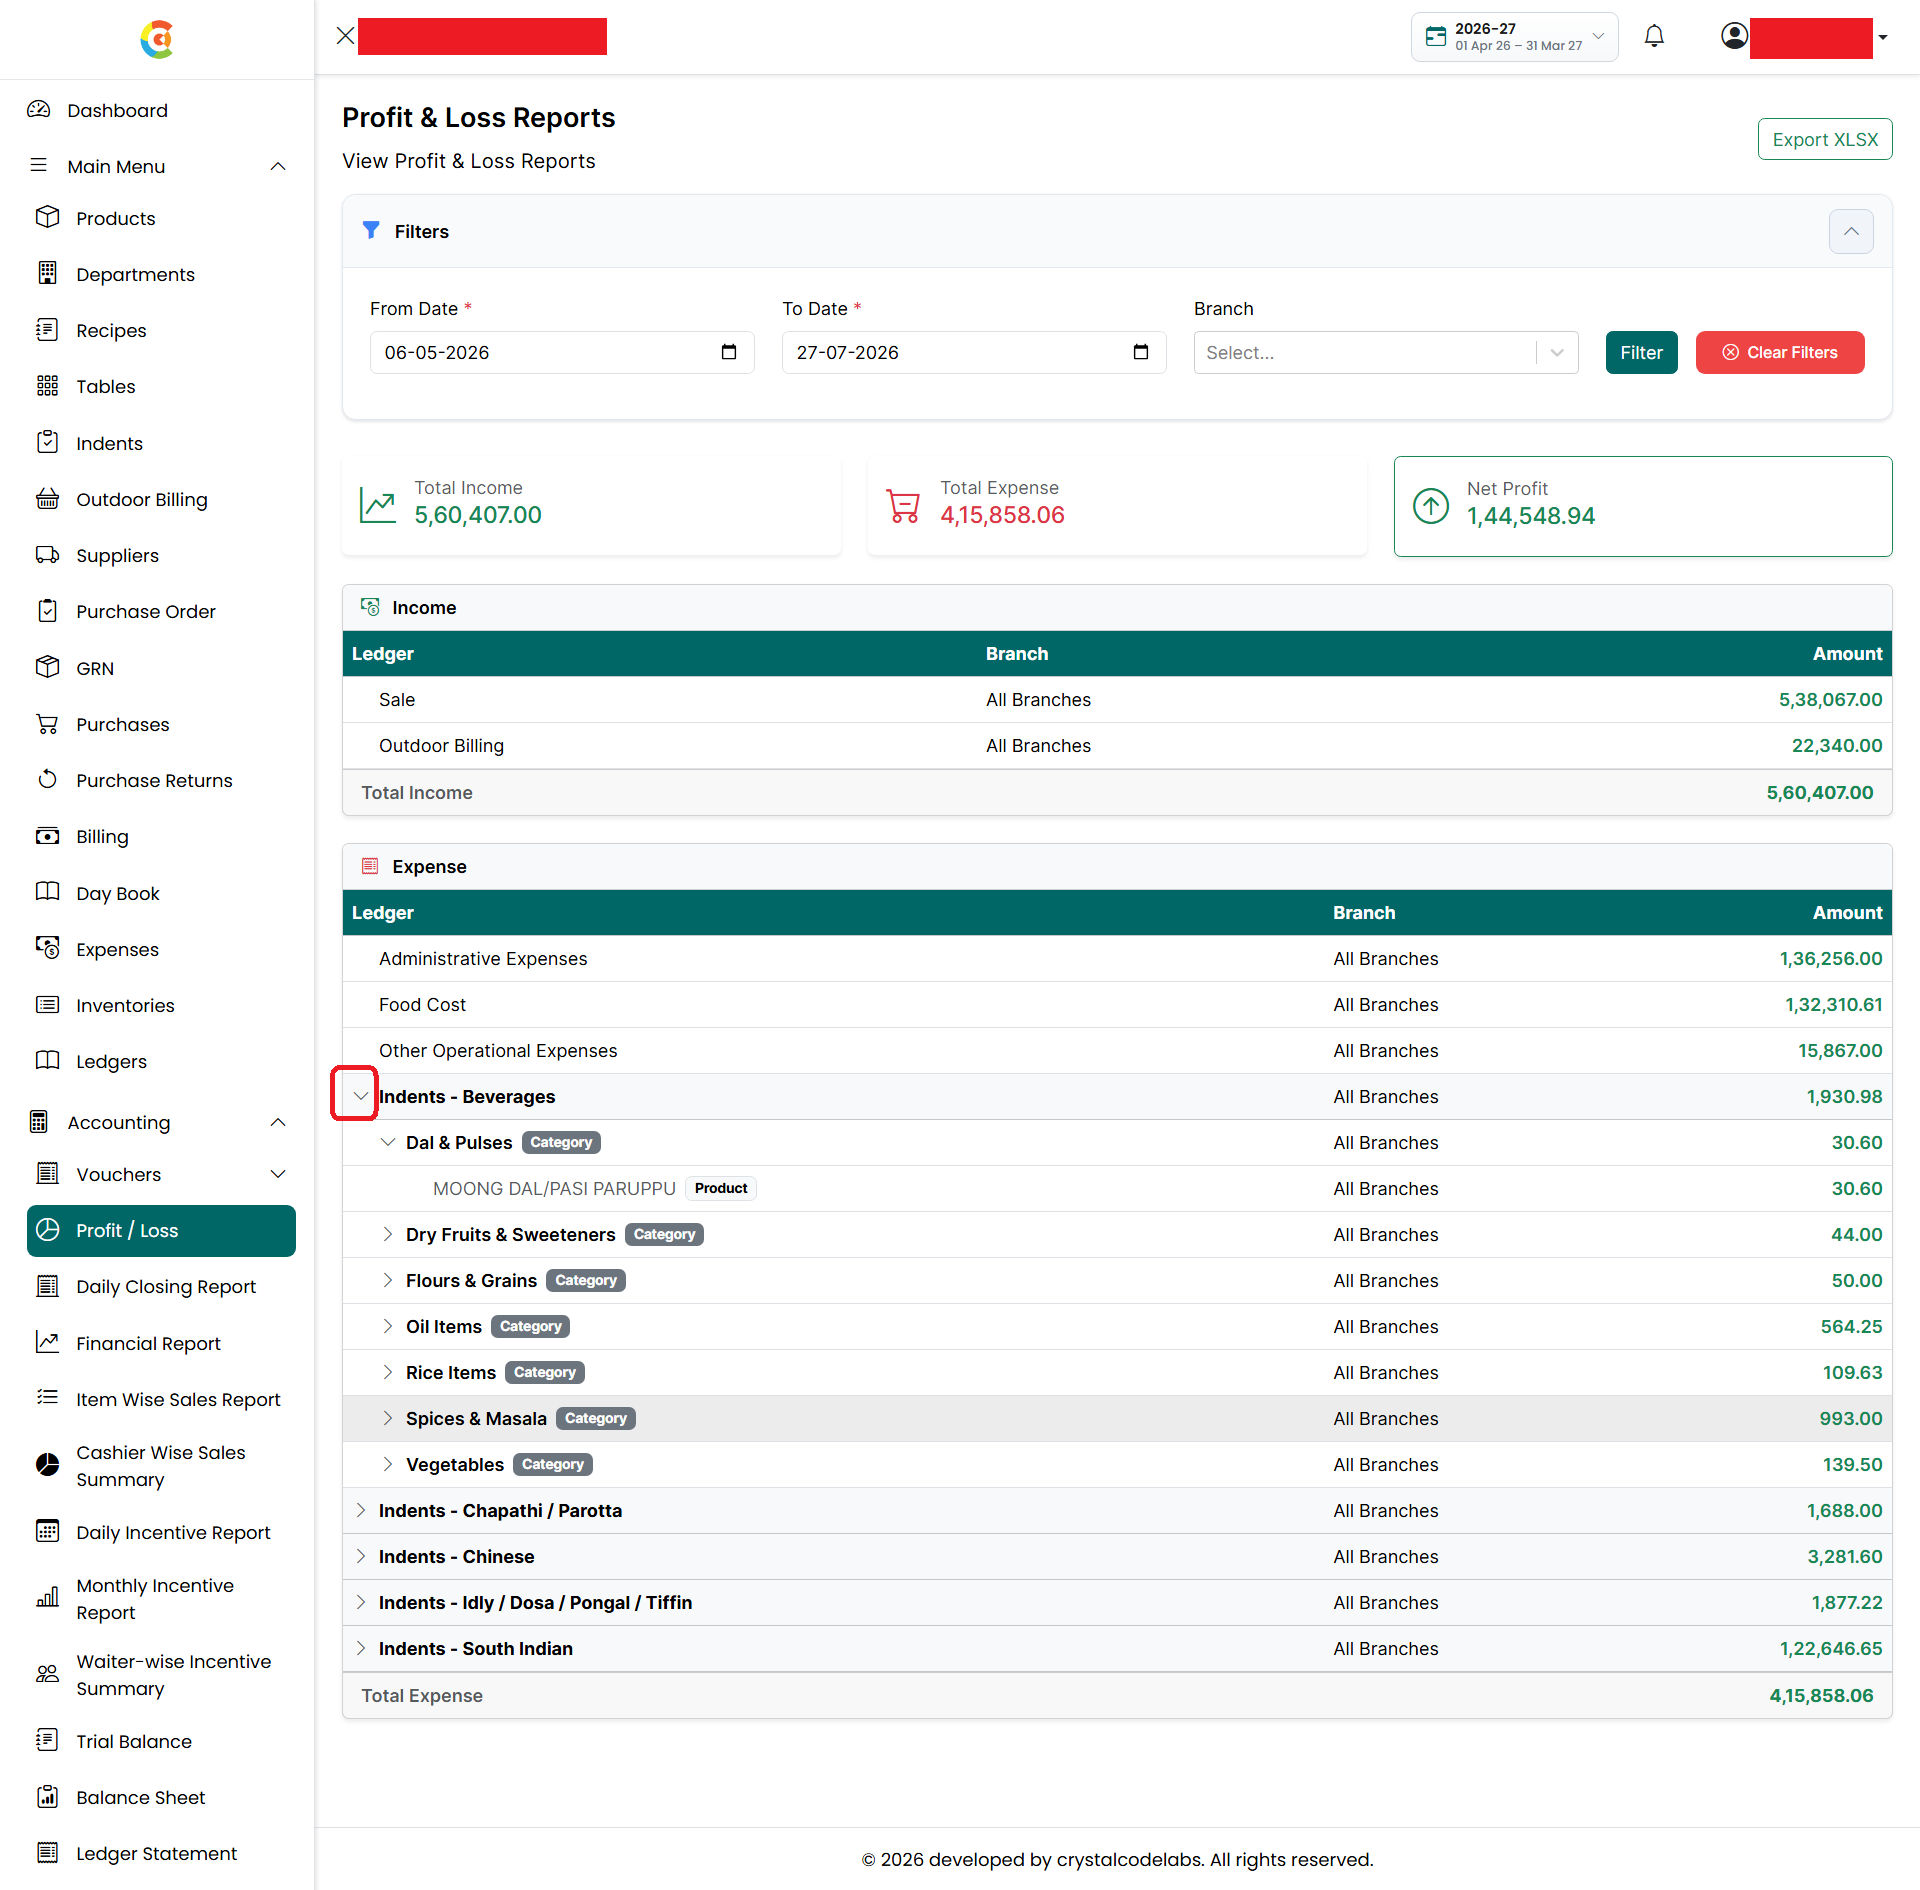
- Click the expand (\>) icon beside a category to view the individual products and their corresponding expense amounts.
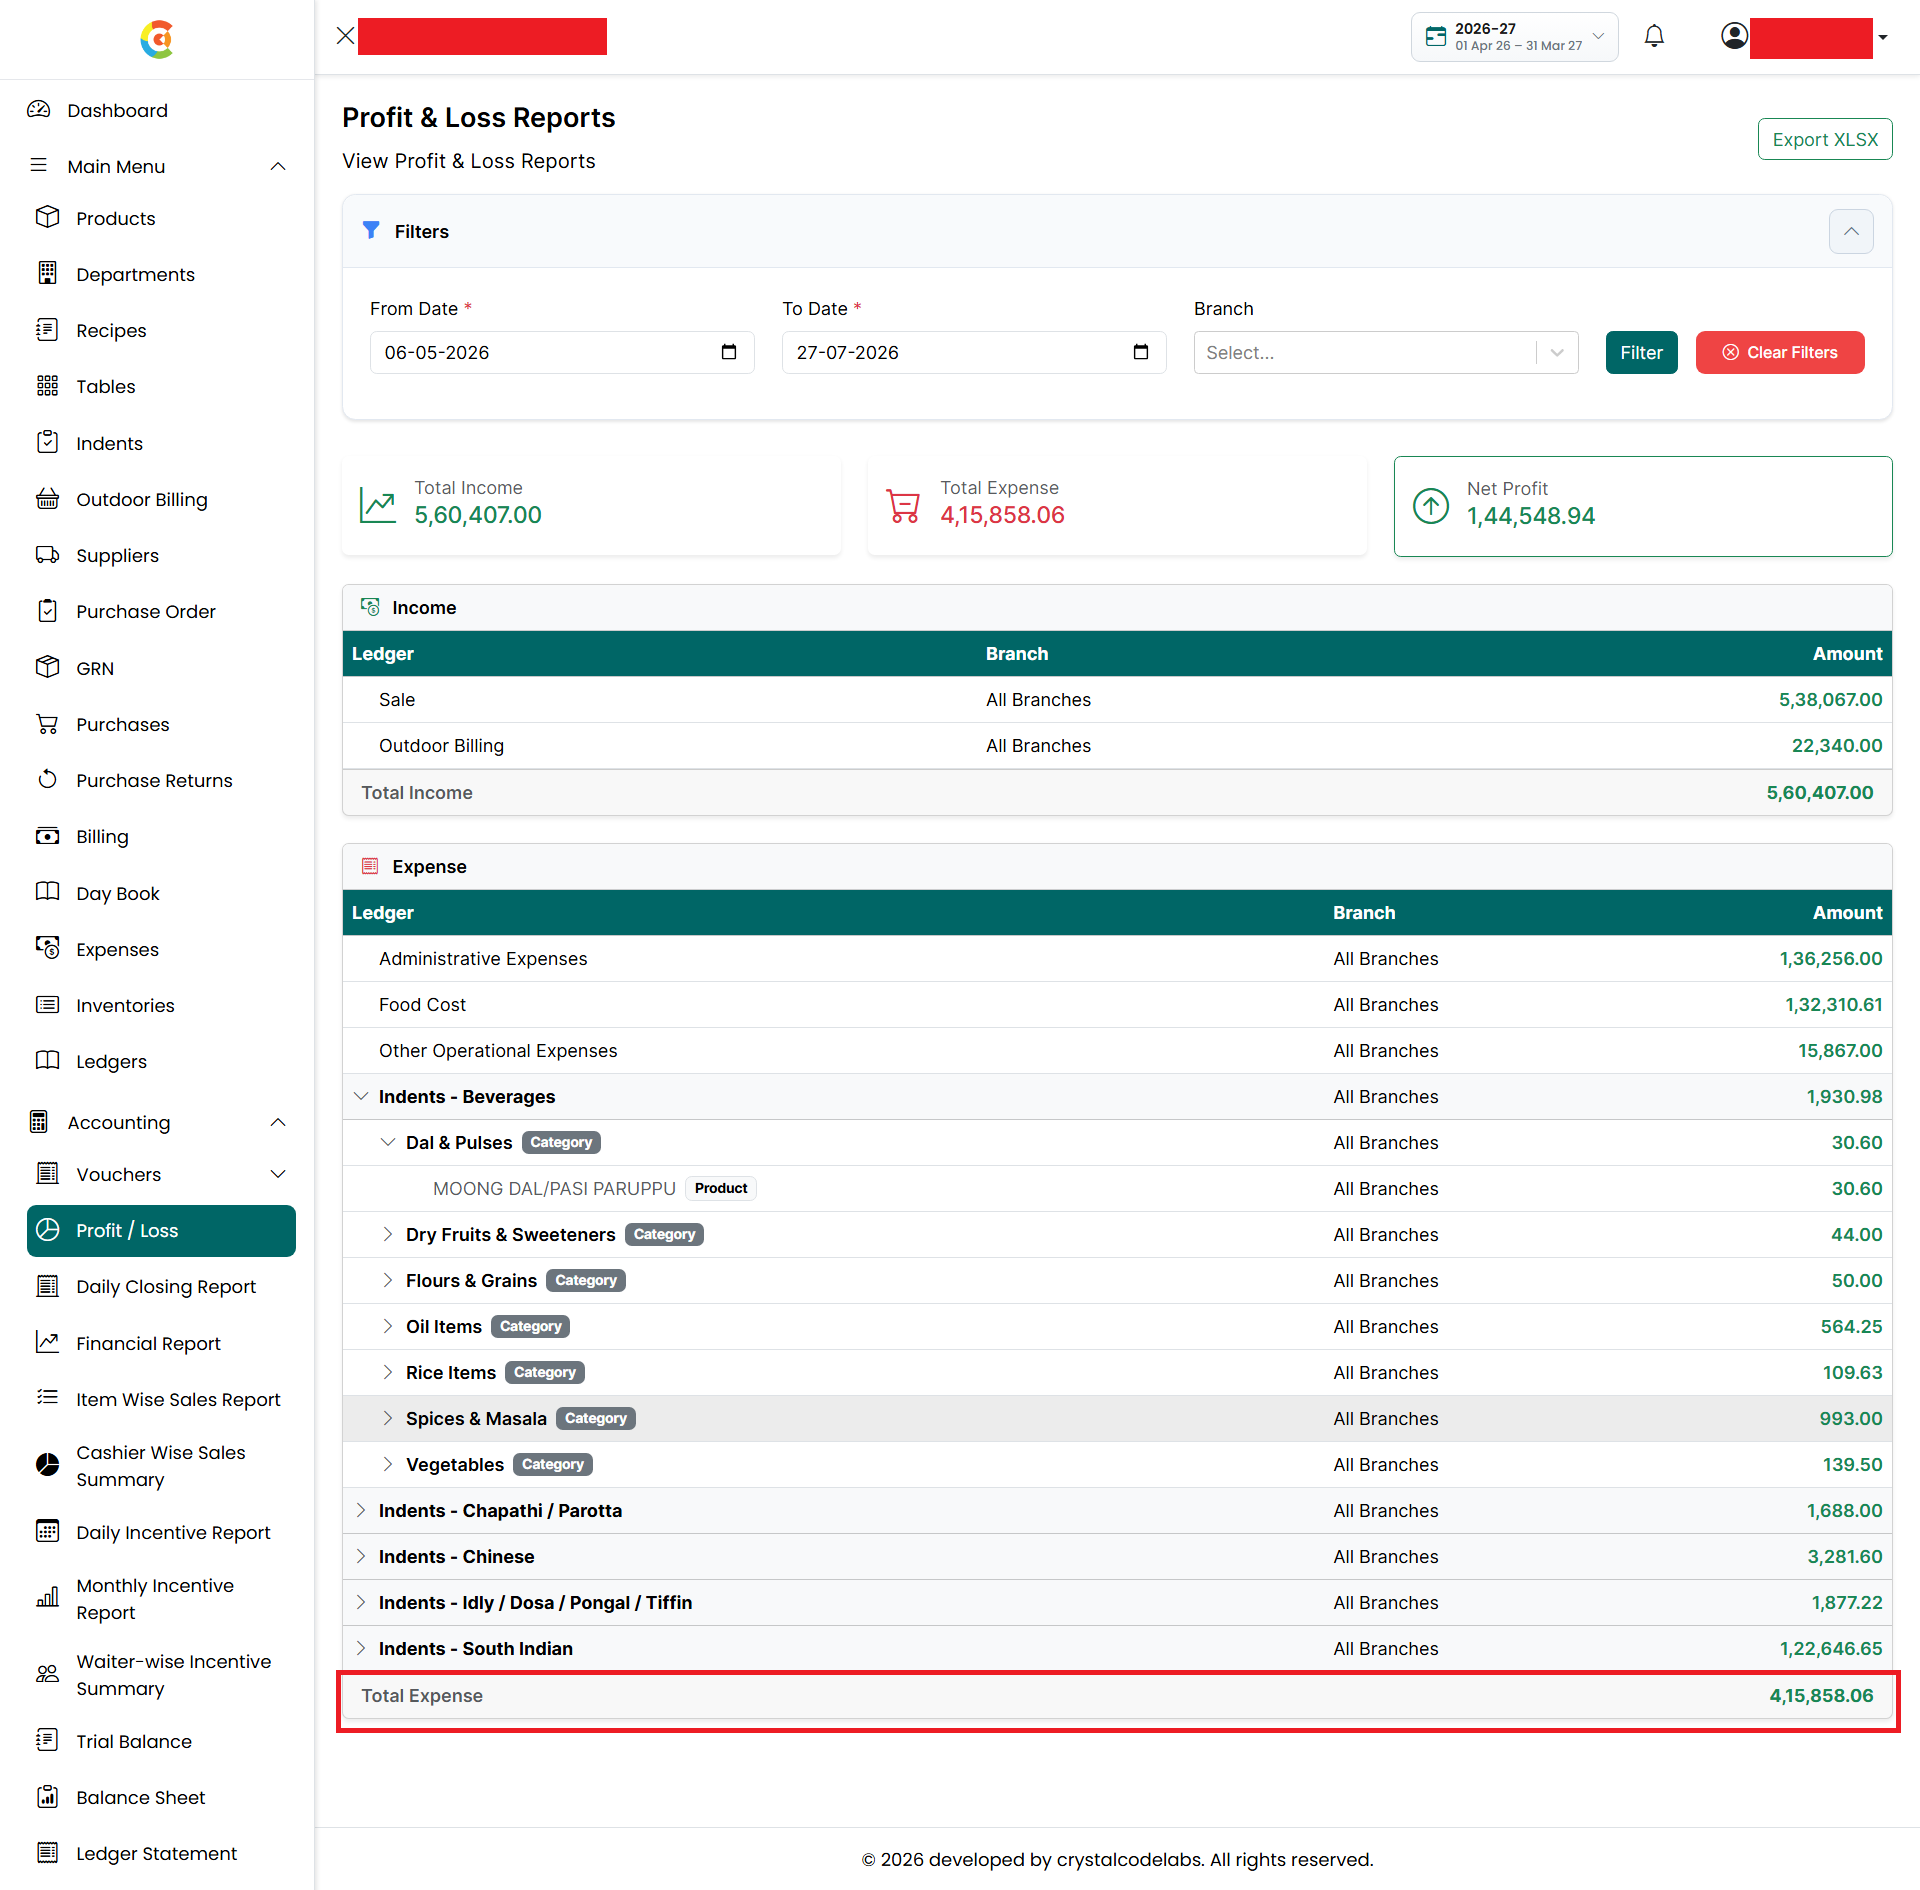
- The Expense section includes:
- Administrative Expenses
- Food Cost
- Other Operational Expenses
- Kitchen Indent Consumption - Kitchen indent consumption displays the value of raw materials consumed by each department, grouped by category and product.
- The report displays Total Expense at the bottom of the Expense section.
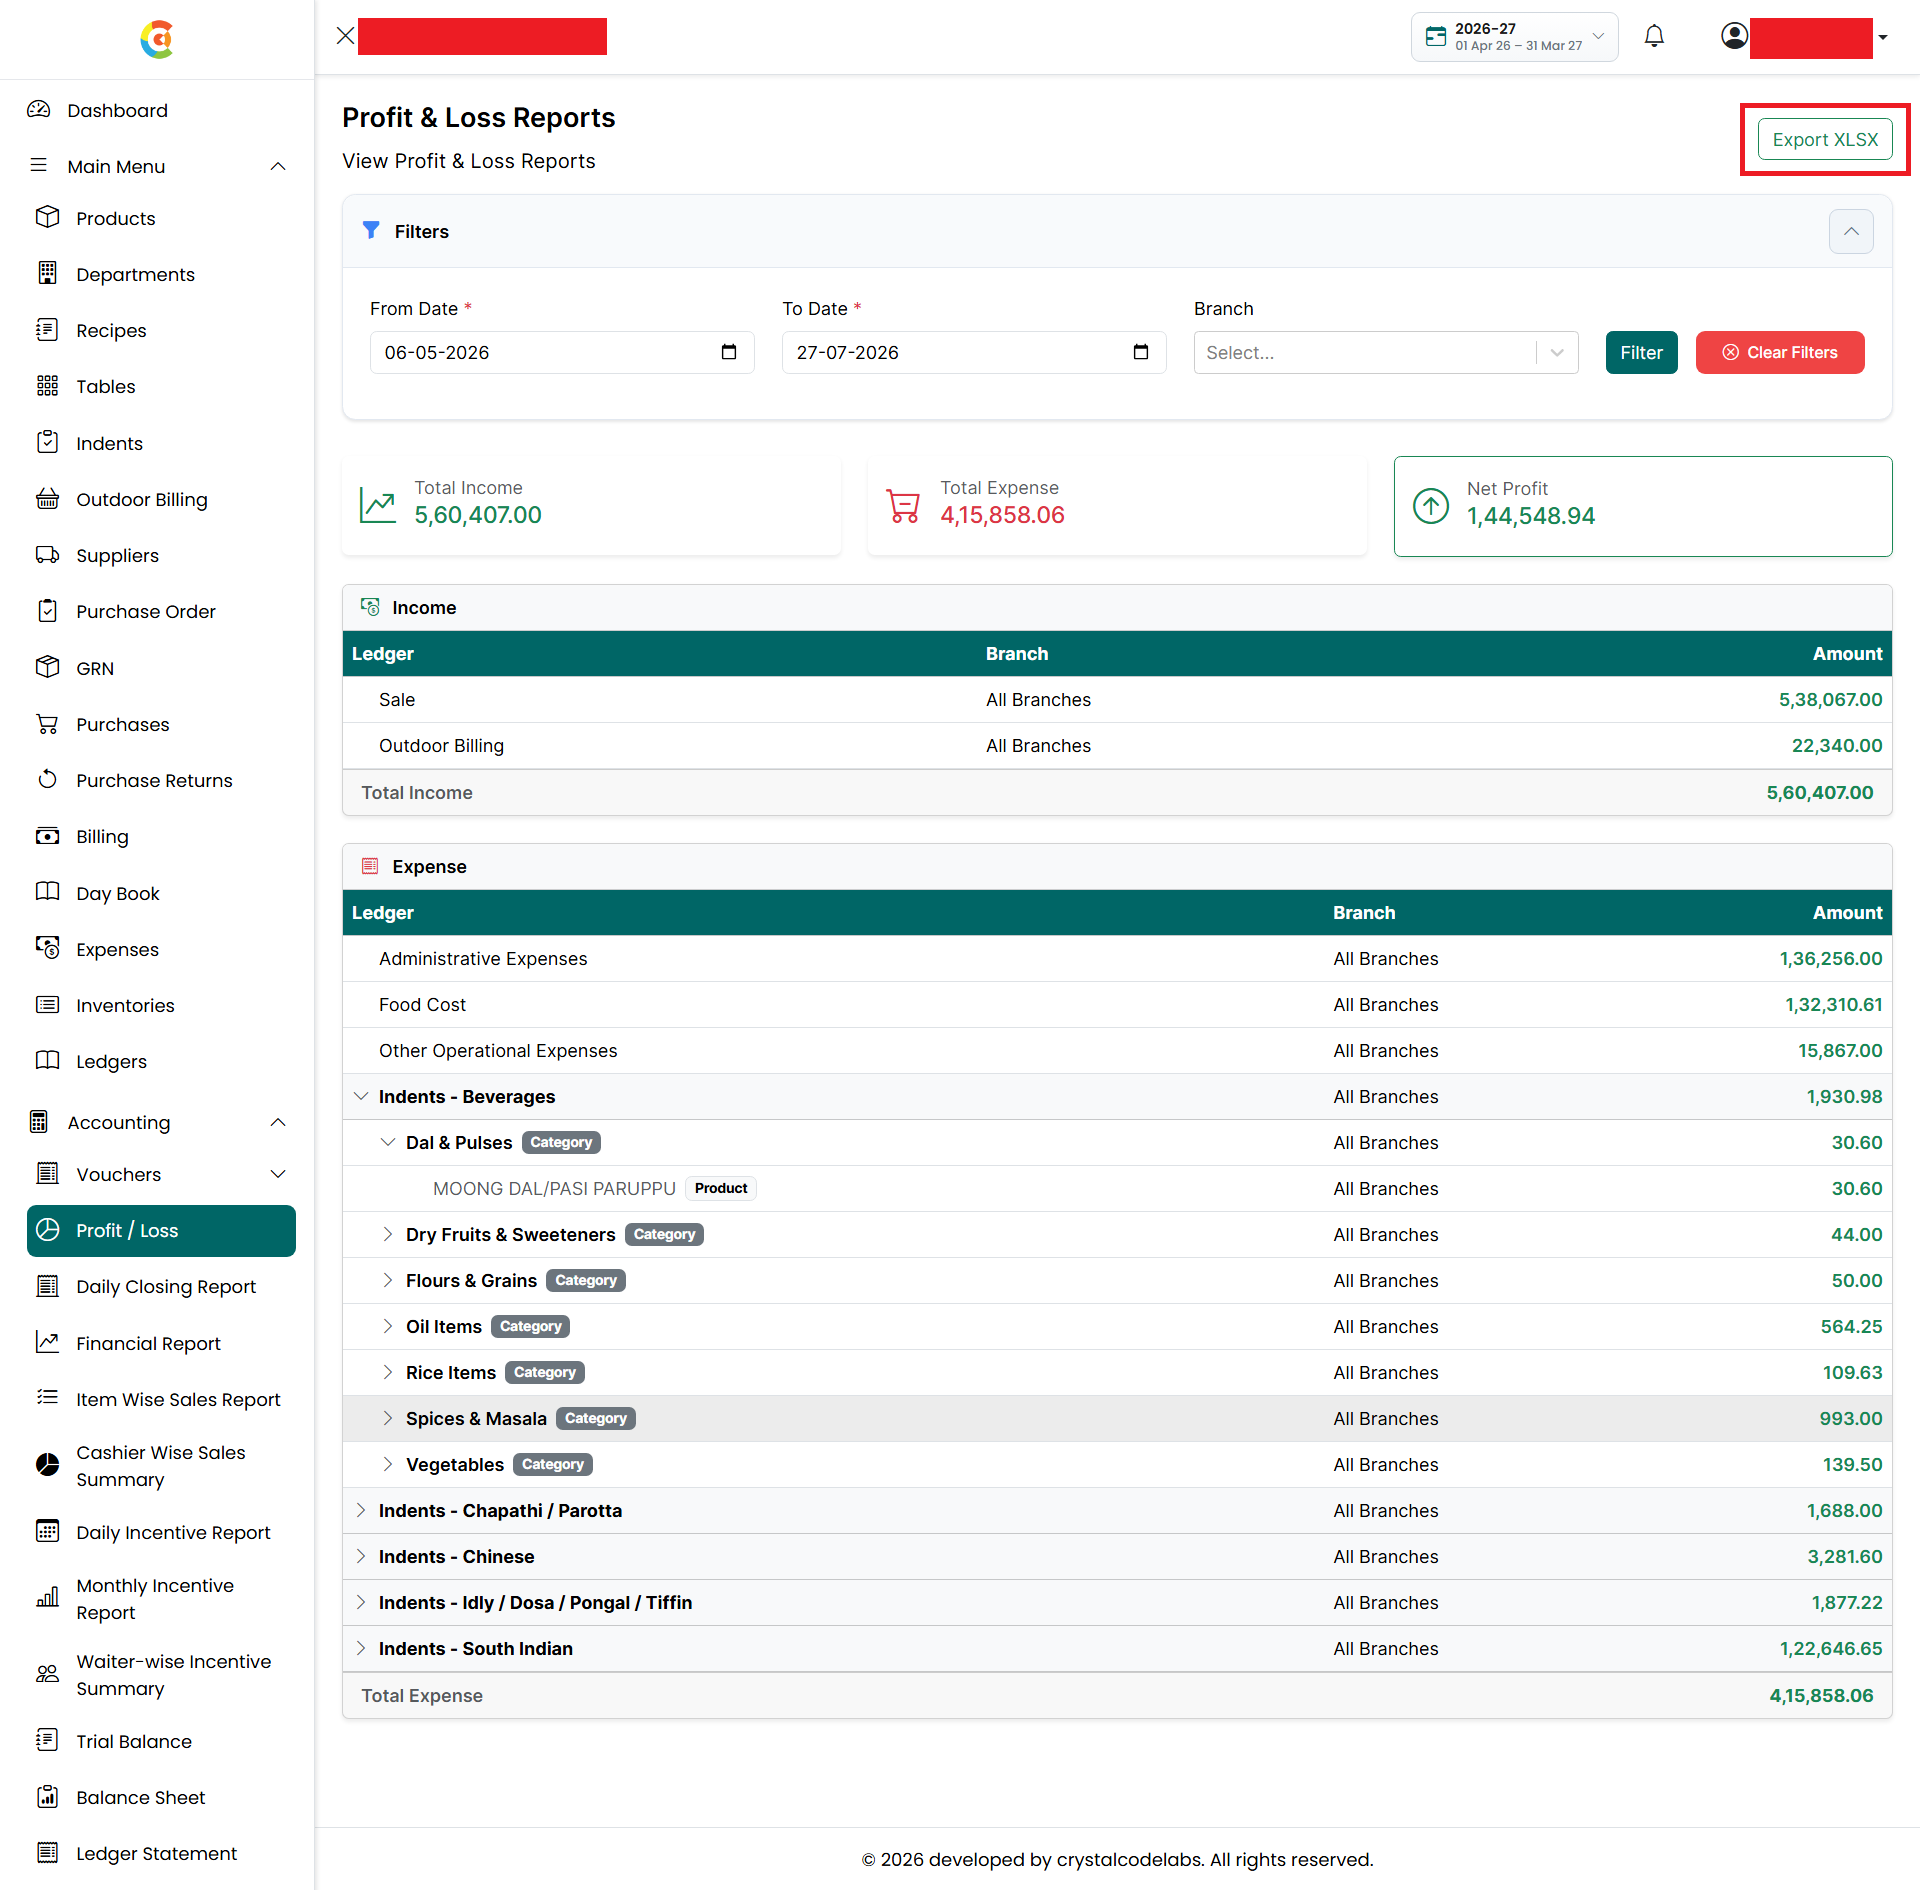
- Export
- Click Export XLSX to download the Profit & Loss report as a Microsoft Excel file based on the currently applied filters.
- The exported report includes:
- Report period
- Branch
- Income details
- Expense details
- Department-wise indent consumption
- Category-wise expenses
- Product-wise expenses
- Total Income
- Total Expense
- Net Profit

Notes
- For the Restaurant Vertical, income is calculated from Sales and Outdoor Billing.
- Operational expenses include manual expenses and the value of raw materials consumed through Approved Kitchen Indents.
- Inventory purchases received through Goods Receipt Notes (GRNs) are not treated as expenses immediately. They become expenses only when the corresponding stock is consumed through approved kitchen indents.
- Department, Category, and Product levels can be expanded or collapsed to analyze raw material consumption in detail.
- The report is generated based on the selected date range and branch filters.